Alert to Incident Under Load
Edge-case behaviour, throughput limits, and how the incident workers are made horizontally scalable and fail-safe.
Executive summary
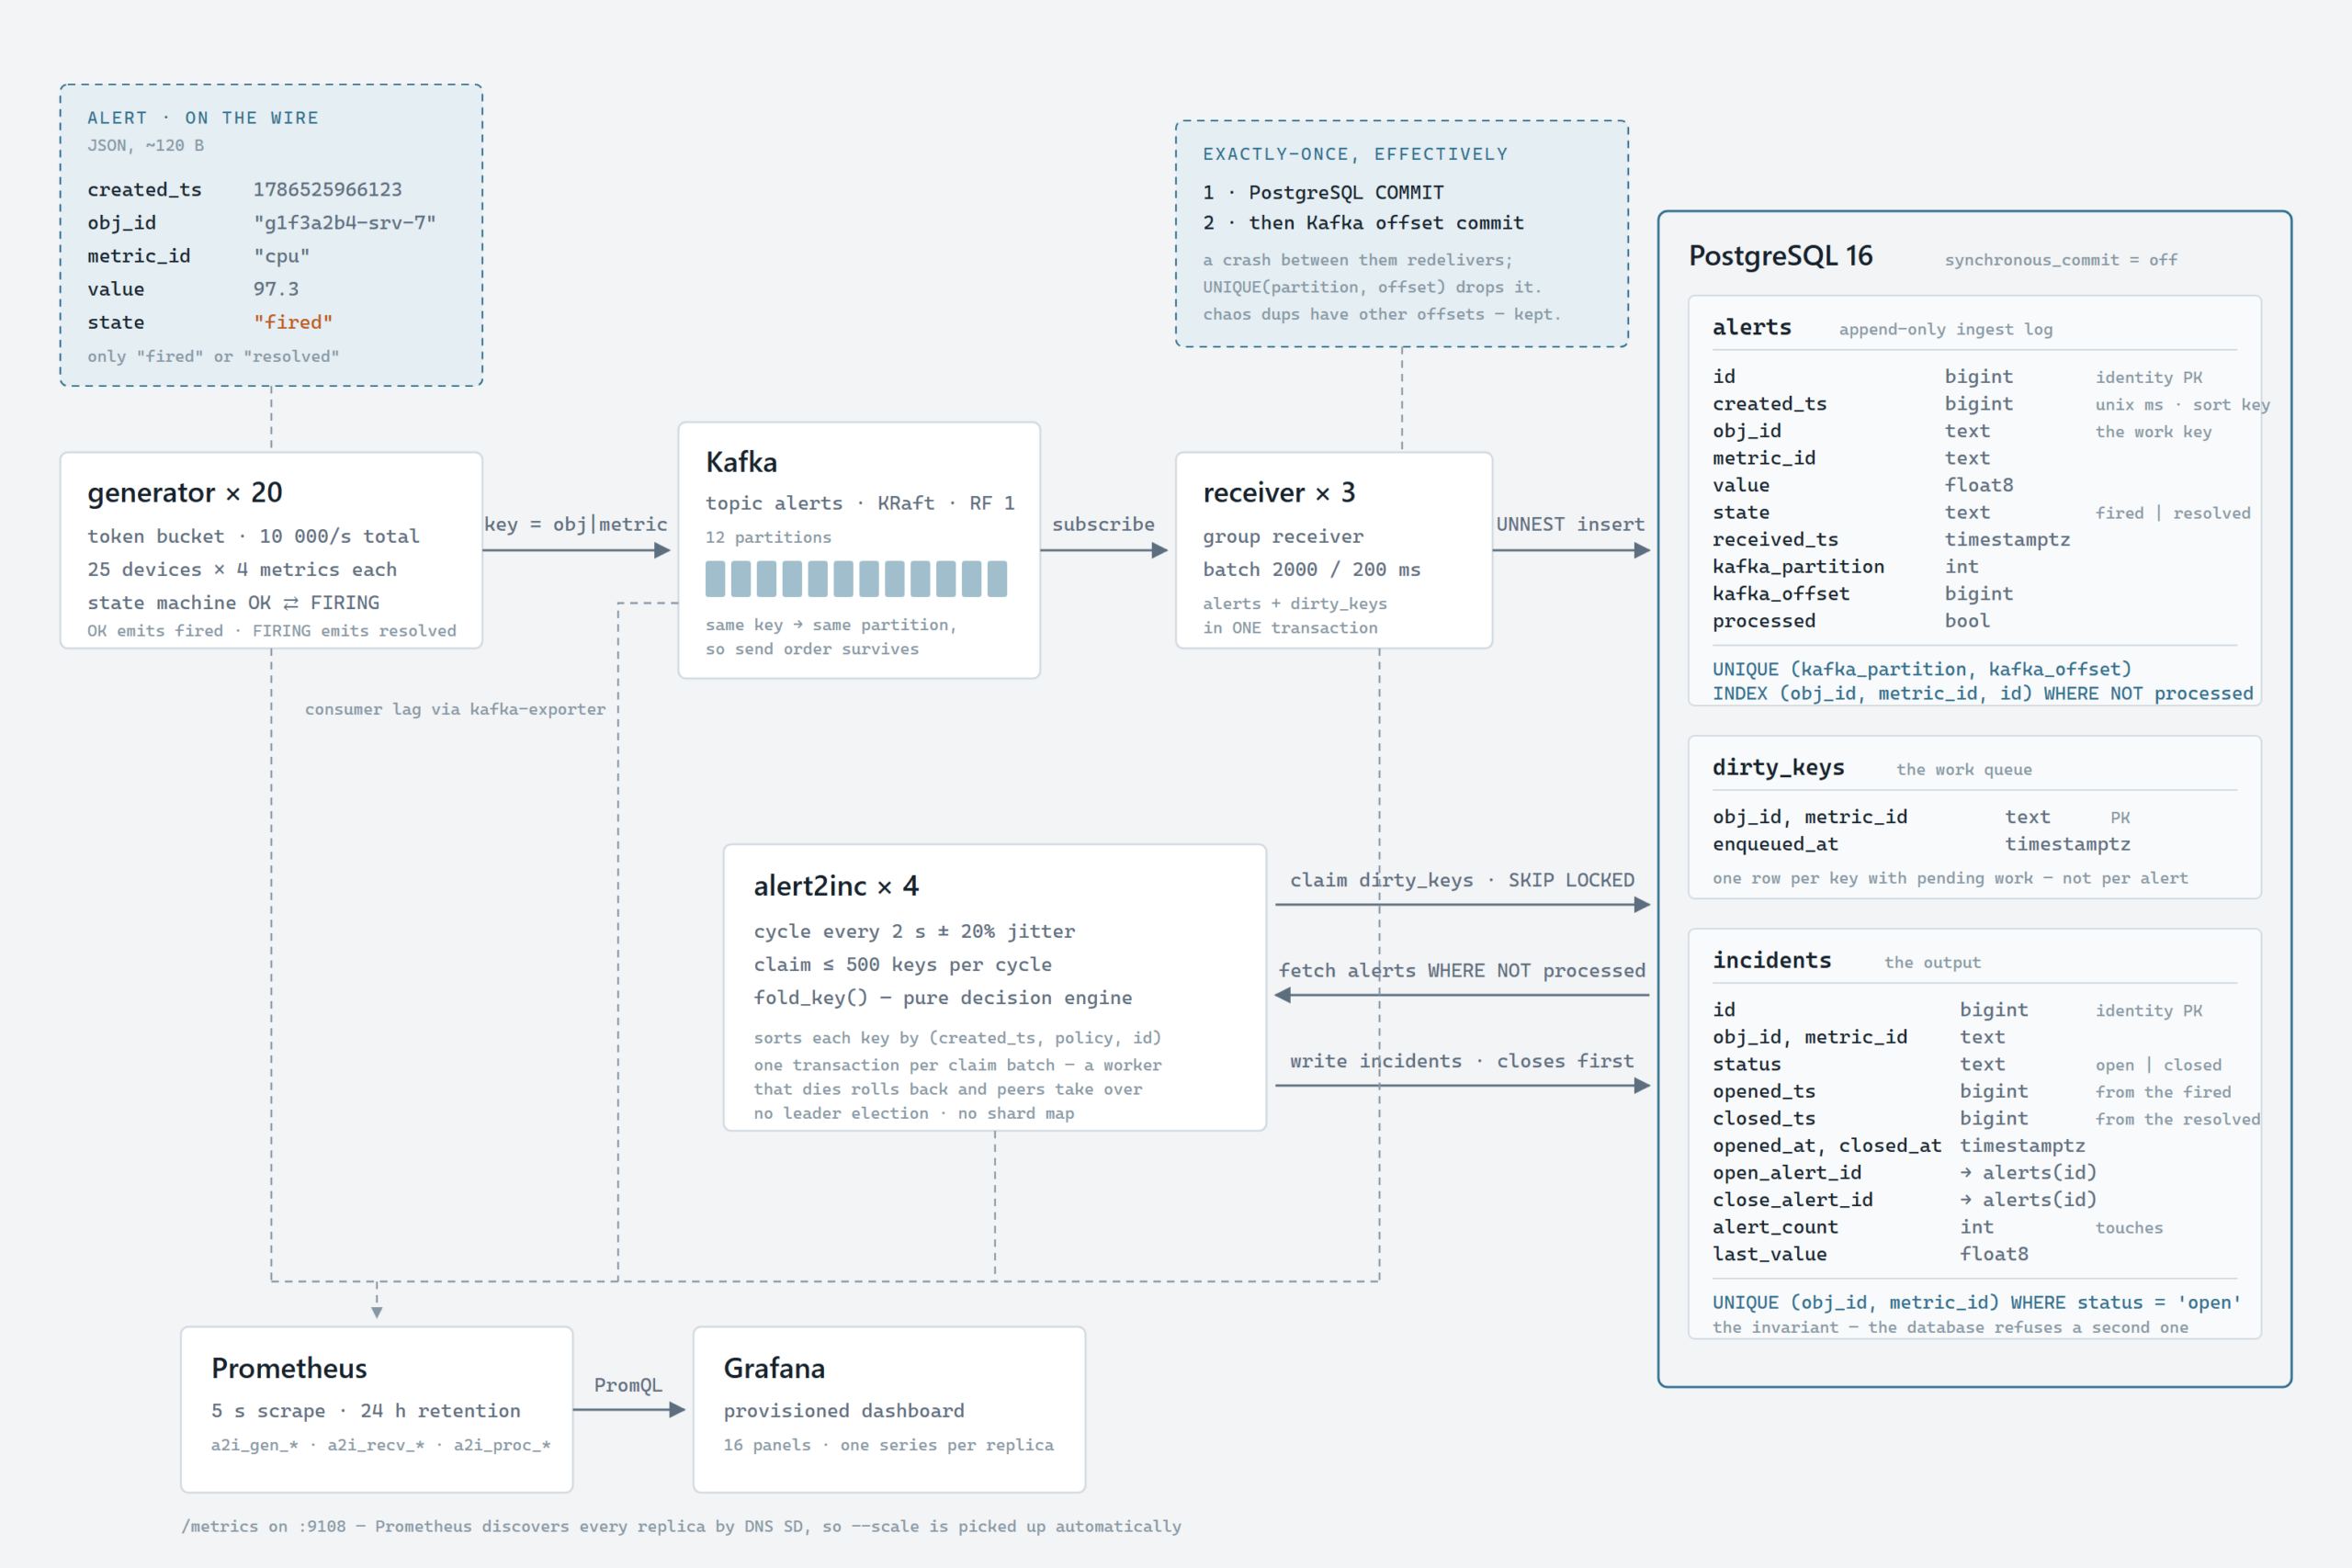
We built a test rig that emulates tens of programs emitting alerts, carries them through Kafka
into PostgreSQL, and turns unresolved fired alerts into incidents using a pool of
workers. The exercise had three questions to answer, and all three are answered.
Do the awkward alert cases behave predictably? Yes. Eighteen deterministic scenarios covering same-millisecond pairs, duplicates, out-of-order arrival, flapping, late and never resolving, grace periods and stale resolves all pass against real Kafka and real PostgreSQL — 18/18.
Does the infrastructure hold up under heavy load? Yes, with a wide margin. The design target was 6000 alerts/s; the rig held it exactly for 33.5 minutes with every gate met by 4–18×. Pushed to 10 000 and then 20 000 alerts/s — 3.3× the target — it held each rate exactly, on unchanged hardware and an unchanged topology. At 20 000/s the worst gate was still 2.6× inside its limit. No ceiling was found, though 20 000/s is the first rate to show any sign of pressure.
Can the workers scale out and survive failure? Yes, and the mechanism is smaller than
expected: a work-queue table plus one PostgreSQL clause, FOR UPDATE SKIP LOCKED.
There is no leader election, no shard map and no membership protocol. We killed a worker
mid-cycle under live load and the unprocessed backlog never moved off zero.
- 18/18
- edge-case scenarios
- 20 000/s
- peak sustained
- 40 M
- alerts processed
- 0
- errors, all runs
1 Introduction
The system being emulated is an ordinary piece of monitoring plumbing: devices and
applications emit alerts, and something downstream decides when a run of alerts constitutes an
incident worth a human’s attention. An alert carries five fields — a creation timestamp
in milliseconds, an object id, a metric id, a value, and a state of either fired or
resolved.
That sounds simple until you look at the edges. What if a fired and its
resolved carry the exact same millisecond? What if the resolved is sent
first, or is stamped earlier than the fired it belongs to? What if a device flaps thirty times a
minute? Each of these has a defensible answer, and the point of the exercise was to make those
answers explicit and testable rather than accidental.
Three questions drove the work:
- Correctness at the edges. Do ambiguous alert sequences produce a defined, repeatable outcome? Acceptance gate: 18 deterministic scenarios, all passing.
- Behaviour under load. Does the pipeline stay healthy at production-like rates, and where does it break? Acceptance gate: consumer lag, end-to-end latency, processing backlog, cycle time and error counts all inside defined limits at 6000 alerts/s.
- Scalable, fail-safe processing. Can the incident workers run several at a time without disturbing each other, and does the system survive one of them dying mid-work? This was the least obvious part of the design at the outset, so it gets its own section below.
2 Run infrastructure
Everything ran on a single workstation. The only host-level installation is Docker Desktop; every component of the rig — brokers, database, applications, monitoring — runs in containers.
| Layer | Detail | Why it matters here |
|---|---|---|
| CPU | AMD Ryzen 9 5950X — 16 cores / 32 threads | Enough parallelism to run 27 application containers plus infrastructure without the generators starving the consumers |
| Memory | 63.9 GB | Kafka heap, PostgreSQL shared buffers and 27 Python processes fit comfortably; the run never approached the limit |
| Motherboard | MSI MPG B550 GAMING CARBON WIFI (MS-7C90) | Relevant only because the virtualisation switch lives in its firmware — see below |
| Operating system | Windows 10 Pro 22H2, build 19045 | The rig is driven by PowerShell scripts; all workloads are Linux containers |
| Virtualisation | AMD-V / SVM, enabled in firmware | Hard prerequisite. It was disabled out of the box and Docker Desktop refuses to start without it, reporting only “virtualisation support not detected” |
| Container runtime | Docker Desktop 4.86.0, engine 29.7.2 | Compose profiles select which parts of the rig run |
| Backend | WSL2 — kernel 6.18.33.2, WSL 2.7.11 | Linux containers run in a real Linux kernel rather than emulation, which is why a single desktop reaches these rates |
| Resource budget | 24 GB RAM, 24 processors, 8 GB swap | Set in .wslconfig; leaves 8 cores and ~40 GB to Windows so the host stays responsive during a run |
| Peak container count | 33 | 20 generators, 3 receivers, 4 workers, plus Kafka, PostgreSQL, Prometheus, Grafana, Kafka UI and the Kafka exporter |
Two deployment details worth carrying forward
WSL2 rather than Hyper-V is not a cosmetic choice — the container disk layout differs, and so
does where the data physically lives. On this machine the system drive had only ~10 GB free while
a 30-minute run at 6000 alerts/s produces roughly 7 GB of database and broker data on top of ~3 GB
of images. The Docker data disk was therefore relocated to a data drive. The setting that does
this for the WSL2 backend is CustomWslDistroDir; the more obvious-looking
DataFolder is accepted without complaint but silently ignored, because it belongs to
the Hyper-V backend.
3 Main components
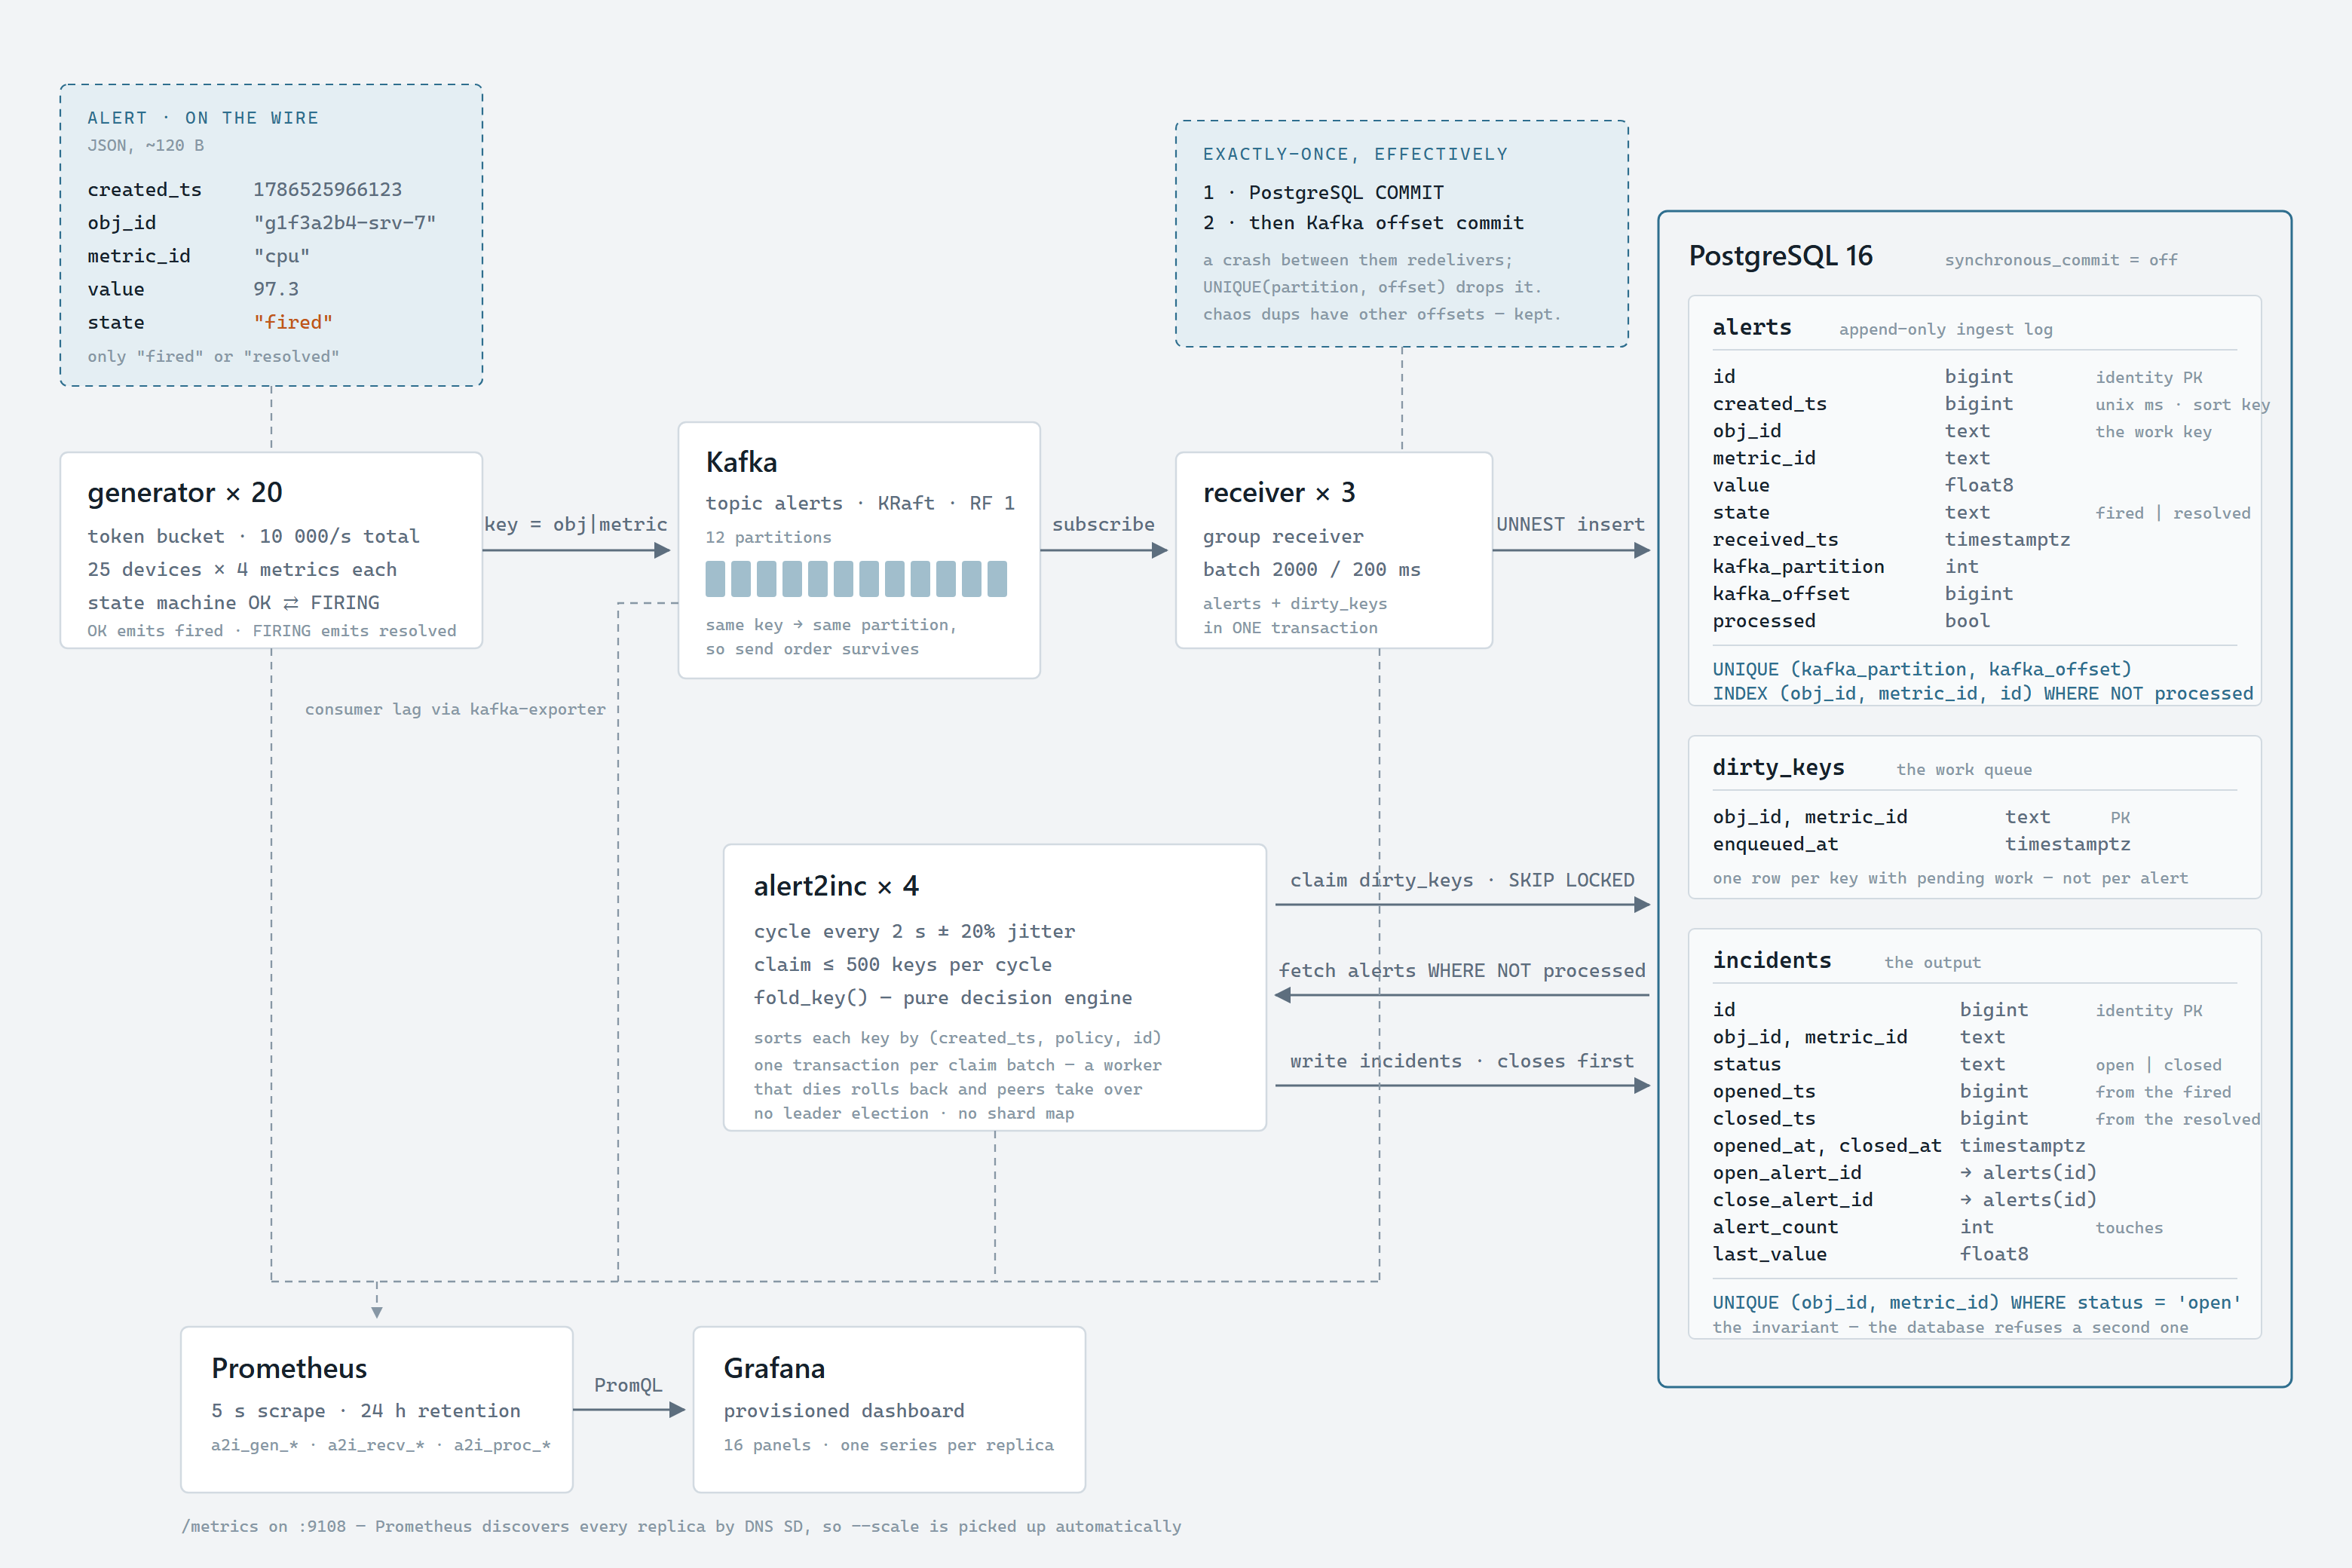
Generator
Emulates the fleet. Each replica owns 25 devices × 4 metrics, named from a 32-bit checksum of
its hostname so that keys do not collide across replicas — practically rather than provably, at a
collision probability around 5 × 10⁻⁸, and no collision occurred in the 20-replica runs. It
drives each device through a two-state machine: a device in OK emits a
fired, a device in FIRING emits a resolved. A token bucket
enforces the total rate, which is a single configuration value — 5000/m for
functional work, 6000/s or 10000/s for stress. Replicas discover how
many of them exist through DNS and divide the target rate automatically, so
--scale generator=20 needs no other change. A chaos layer, off by default, injects
the awkward cases described in section 5.
Kafka
The buffer between producers and the database, running as a single KRaft node with the topic
alerts split across 12 partitions. Every message is keyed by
obj_id|metric_id, so all alerts for one device-and-metric land in one partition
in send order. This matters more than it first appears: deliberately injected disorder
must survive the transport rather than being accidentally repaired by it. If the database slows
down, alerts queue here as visible consumer lag instead of being lost.
Receiver
The only writer of alerts. It buffers incoming messages and flushes on whichever comes first,
2000 messages or 200 ms, inserting each batch with a single multi-row statement. It commits the
PostgreSQL transaction first and its Kafka offsets second. A crash between the
two causes redelivery, and redelivered rows collide with a unique constraint on
(kafka_partition, kafka_offset) and are dropped. The net effect is that every alert
lands exactly once, while deliberately duplicated alerts — which carry different offsets — still
reach the decision logic, which is the point.
One limit on that guarantee, since it is easy to overstate: it covers receiver crashes
while PostgreSQL survives. This rig runs with synchronous_commit = off (§2), so a
PostgreSQL crash can lose the last few hundred milliseconds of already-acknowledged commits — and
their Kafka offsets are by then committed too, so those alerts are not redelivered. That is an
accepted tradeoff for a load generator, not a property to copy into production. With durable
commits enabled, the exactly-once claim holds against database crashes as well.
alert2inc workers
The component under study. Each worker wakes on an interval, claims a batch of work, folds each key’s alerts into a decision, and writes incidents. The decision itself is a pure function, which is what makes both testing and crash recovery straightforward. Section 4 covers this in full.
PostgreSQL
Three tables. alerts is an append-only ingest log carrying a monotonic
id that doubles as the tie-break of last resort for same-millisecond cases.
dirty_keys is a tiny work queue holding one row per key with pending work — not one
per alert. incidents is the output, with a partial unique index on
(obj_id, metric_id) WHERE status='open' that enforces at most one open incident per
key. That index is the system’s headline invariant, and it is enforced by the database rather than
trusted to the workers.
Prometheus and Grafana
Every application exposes metrics on a fixed port and Prometheus discovers replicas by DNS, so scaling a service to twenty instances produces twenty series without touching any configuration. Grafana ships with a provisioned dashboard of 16 panels; every screenshot in this report comes from it.
4 How the workers scale and survive failure
This was the least obvious part of the design, so it is worth doing properly.
The problem
Incident decisions only make sense per key — the pair (obj_id, metric_id). Whether
a fired should open an incident depends on what else happened to that key
and on whether an incident for it is already open. That gives two hard requirements which pull in
opposite directions:
- Two workers must never process the same key at the same time, or they would race on the same incident row.
- Two workers must never block each other, or adding workers would buy nothing.
The obvious solutions are all heavy: elect a leader to hand out work, or shard keys across workers by a hash, or take out leases with timeouts. Each introduces a component that can itself fail, and sharding in particular means reconfiguring when the worker count changes.
The mechanism
The receiver already knows which keys have new alerts, so it records them. In the
same transaction that inserts a batch of alerts, it upserts each touched key into
dirty_keys. Because it is the same transaction, the “this key has work” signal cannot
be lost — either both the alerts and the marker commit, or neither does.
Every worker then runs exactly the same query, with no worker identity in it at all:
SELECT obj_id, metric_id
FROM dirty_keys
ORDER BY enqueued_at
LIMIT 500
FOR UPDATE SKIP LOCKED
FOR UPDATE locks the rows it returns. SKIP LOCKED is the part that
does the real work: rather than waiting for rows another transaction already holds, PostgreSQL
simply passes over them and returns the next available ones. Two workers running this
simultaneously therefore receive disjoint sets of keys, and neither waits for the other
for even a moment.
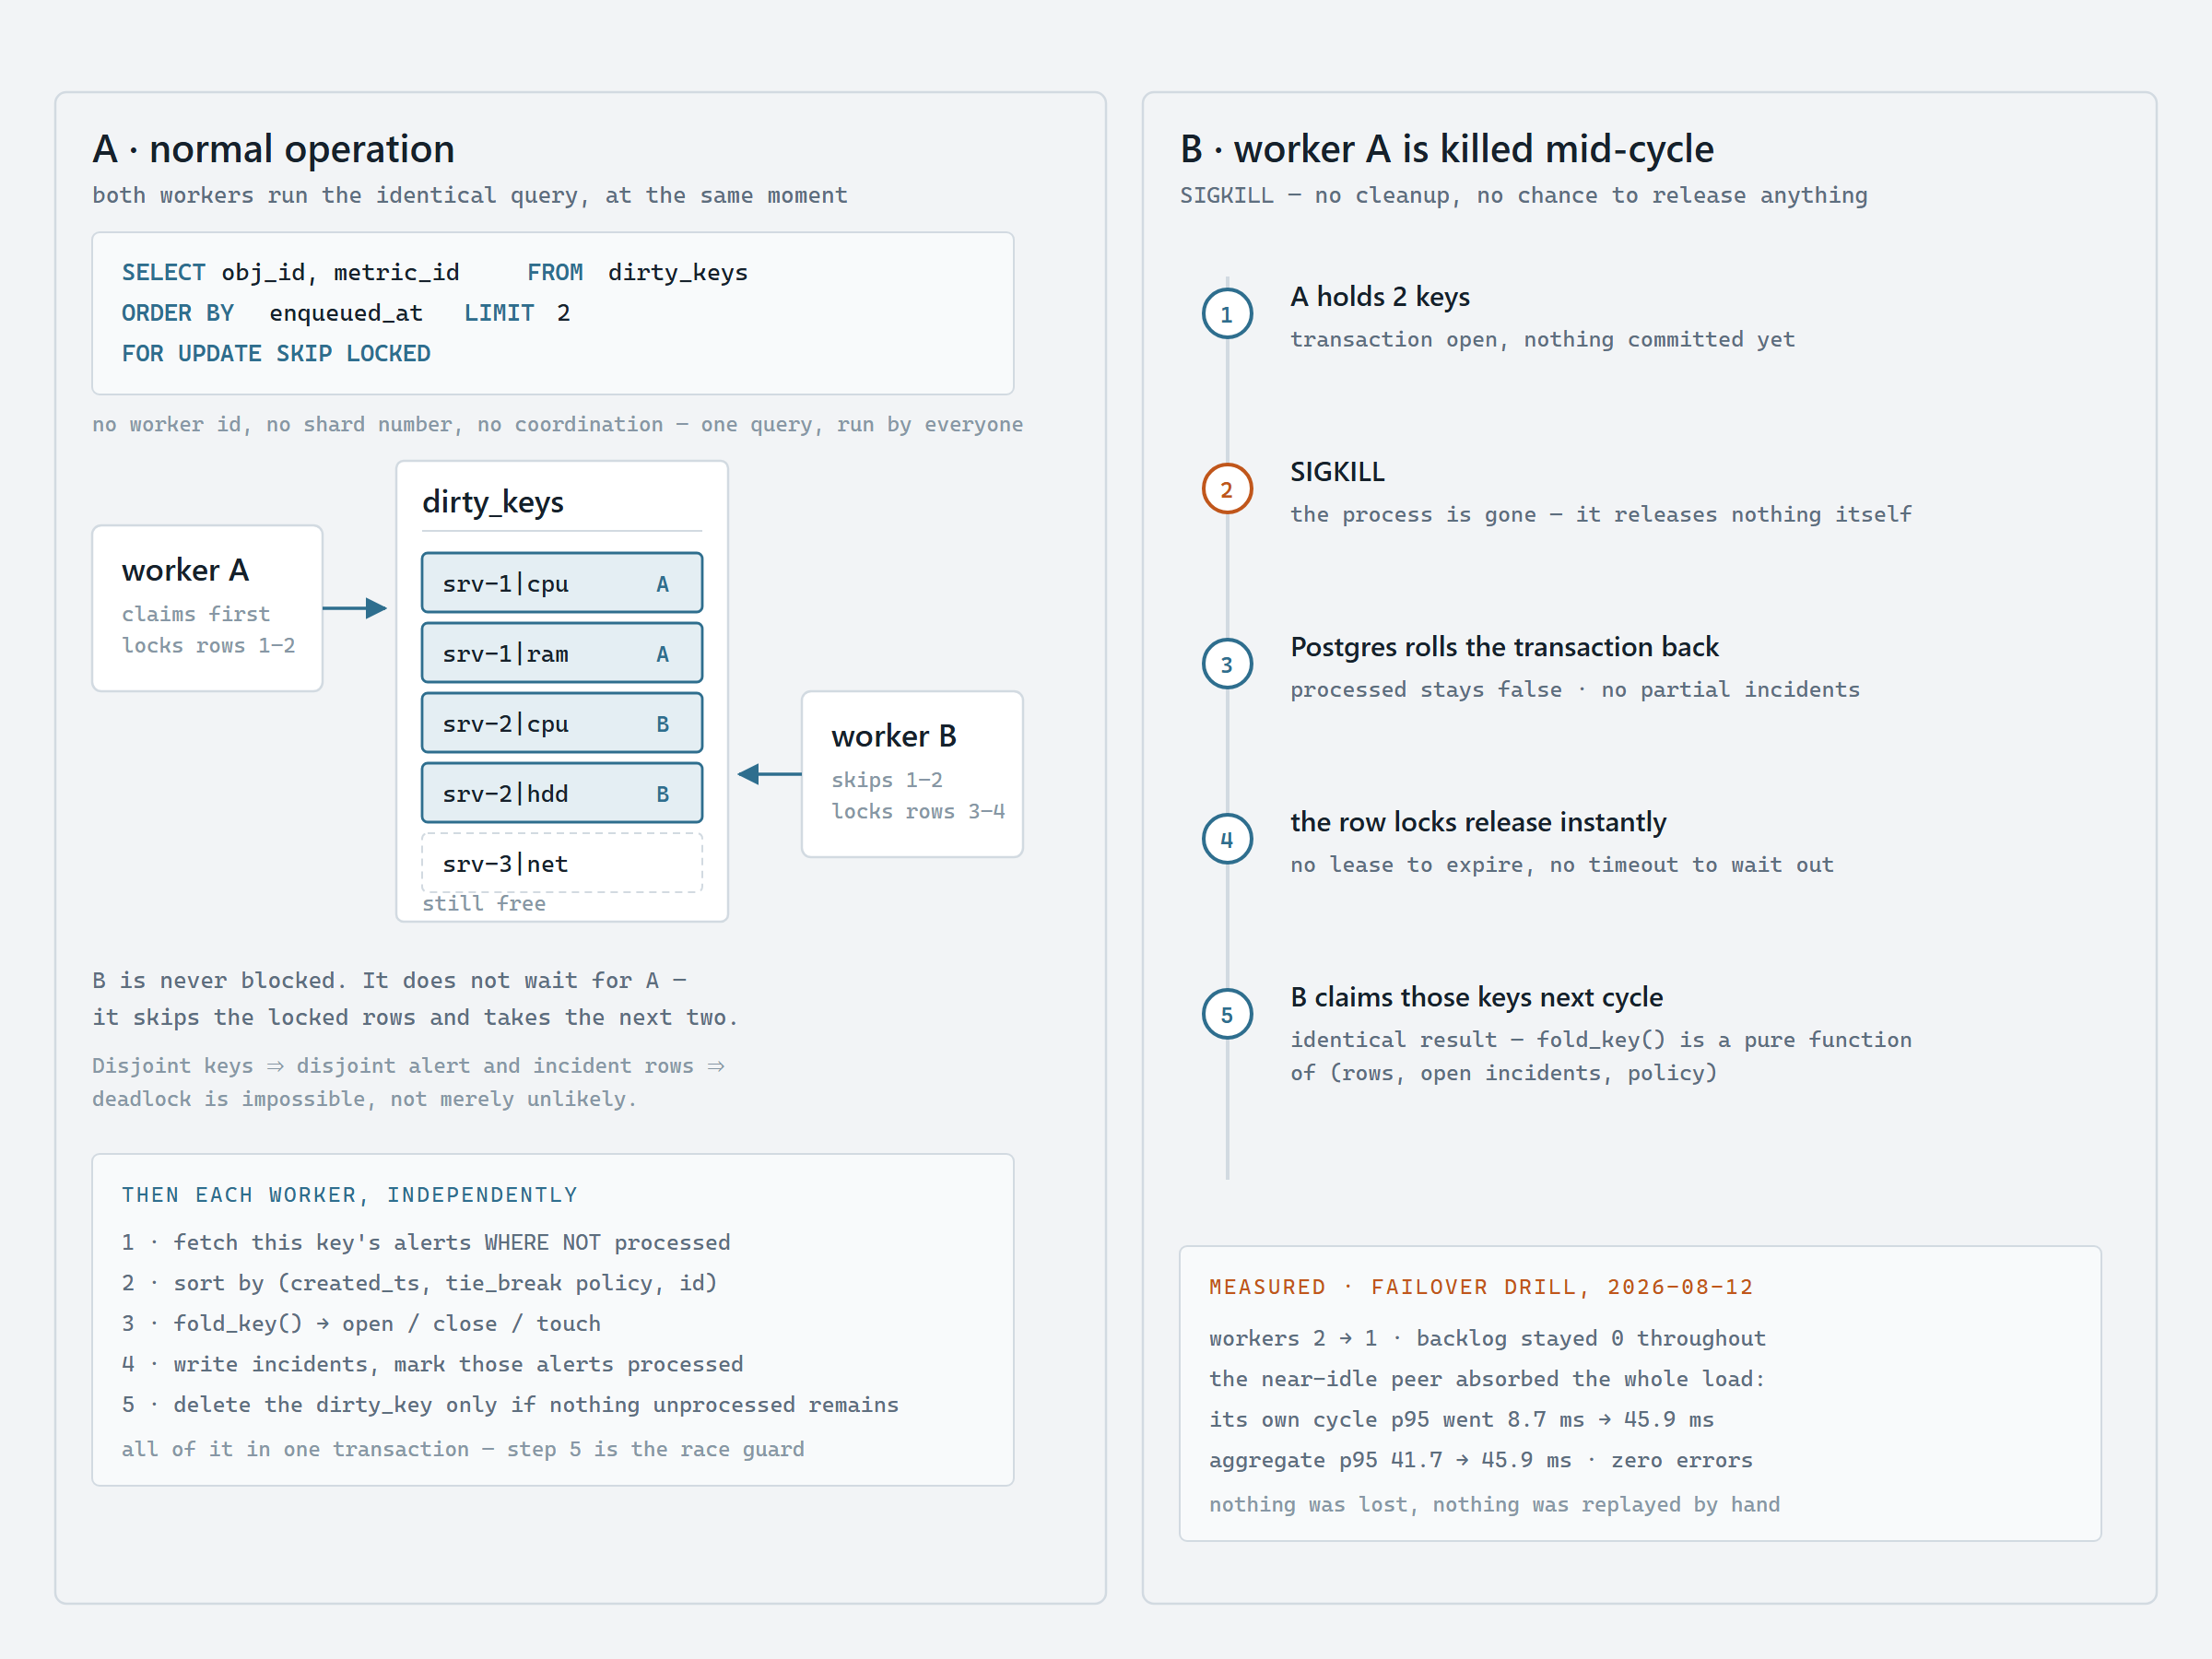
The consequences are worth spelling out, because they are stronger than “it usually works”:
- Disjoint claims imply disjoint rows. If two workers hold different keys, they touch different alert rows and different incident rows. Deadlock is not unlikely — it is impossible, because there is no pair of resources they could hold and want in opposite order.
- PostgreSQL is the coordinator. No leader, no shard map, no membership protocol, no
heartbeats.
--scale alert2inc=4is the entire configuration change needed to go from one worker to four. - The worker count can change at any moment, including during load, because nothing records how many workers there are supposed to be.
What a worker does with its claimed keys
Each worker now works alone, in parallel with the others, on a key set no one else can touch.
It fetches the unprocessed alerts for those keys only, sorts each key’s events by
(created_ts, tie-break policy, id), and folds them into a decision. It applies that
decision — closing before opening, so the partial unique index cannot be tripped by a re-open —
marks those alerts processed, and cleans up. All of it inside one transaction.
Cleanup has a subtlety. A worker deletes a claimed dirty_keys row only if no
unprocessed alerts remain for that key:
DELETE FROM dirty_keys d USING unnest(%s::text[], %s::text[]) AS k(obj_id, metric_id)
WHERE d.obj_id = k.obj_id AND d.metric_id = k.metric_id
  AND NOT EXISTS (SELECT 1 FROM alerts a
                  WHERE a.obj_id = d.obj_id AND a.metric_id = d.metric_id
                    AND NOT a.processed)
If a new alert for that key arrived after the worker took its snapshot, the delete skips it and the key survives for the next cycle. Without that condition, an alert arriving at exactly the wrong moment would have its marker deleted and could sit unprocessed indefinitely.
That guard narrows the race but cannot close it — a defect found reviewing this report, and
since fixed. Nothing sets an isolation level, so the connection runs at READ COMMITTED and the
DELETE takes its own statement snapshot. A receiver that upserts the marker (a no-op,
since the row is still there) and commits its alert after that snapshot leaves an
unprocessed alert with no marker. Under load it self-heals the moment any further alert for that
key re-creates the marker — every run here drained to exactly zero unprocessed — but a key falling
silent right then would strand that alert indefinitely.
It is also common, not exotic. Instrumenting the repair showed it firing 20 times a second at 6000 alerts/s, 30 at 10 000/s and 76 at 20 000/s — scaling with load, roughly one per 250 alerts. Nothing was ever lost because the next alert for that key always arrived within milliseconds and re-created the marker. A quiet key is the only case where it would bite, which is exactly why it survived tens of millions of alerts unnoticed.
The fix is one extra statement, immediately after the delete and in the same transaction, scoped to the keys this worker already holds:
INSERT INTO dirty_keys (obj_id, metric_id)
SELECT DISTINCT a.obj_id, a.metric_id FROM alerts a
JOIN unnest(%s::text[], %s::text[]) AS k(obj_id, metric_id)
  ON a.obj_id = k.obj_id AND a.metric_id = k.metric_id
WHERE NOT a.processed
ORDER BY 1, 2
ON CONFLICT DO NOTHING
Being a later statement, it gets a newer READ COMMITTED snapshot — so it sees precisely the
receiver commits the delete was blind to — and sharing the transaction makes the pair atomic. It
touches at most the claim_keys rows the worker already owns, so no peer is affected,
and it rides the existing partial index. ORDER BY is load-bearing: a consistent insert
order across every writer of the table is what stops concurrent inserts forming a deadlock
cycle.
The first attempt at this fix was worse than the bug, and the failure is instructive. It
had every worker sweep the entire alerts table whenever a claim came back empty. All four
then ran the same scan simultaneously: they deadlocked against one another on
dirty_keys index tuples, and they blocked receivers inserting the same markers.
Consumer lag went to 122 389 and p99 latency to 25 s at 20 000/s — against 7 585 and 0.93 s for the
scoped version. Receivers had never collided with each other because Kafka partitioning gives each
one a disjoint key set; a global sweep was the first thing in the system to touch every key at
once.
Honest scope: this prevents stranding rather than repairing it after the fact. A
residual window remains between the repair statement’s snapshot and the commit, but it is
sub-millisecond instead of “until the next alert for this key”. Verified by
scripts/check-dirty-repair.ps1, which drives two connections statement by statement to
reproduce the interleaving exactly — asserting both that the cleanup really does delete the marker
and that the repair puts it back. Repairs are counted as
a2i_proc_dirty_reseeded_total.
A worked example
Ten alerts have arrived across four keys, nothing is processed yet, and no incidents are open. Two workers are running with a claim limit of two keys each.
| id | created_ts | obj_id | metric_id | state |
|---|---|---|---|---|
| 1 | 1000 | srv-1 | cpu | fired |
| 2 | 1500 | srv-1 | ram | fired |
| 3 | 1800 | srv-1 | ram | resolved |
| 4 | 2000 | srv-2 | cpu | fired |
| 5 | 2000 | srv-2 | cpu | resolved |
| 6 | 2200 | srv-2 | hdd | fired |
| 7 | 2500 | srv-2 | hdd | fired |
| 8 | 2600 | srv-1 | cpu | fired |
| 9 | 2900 | srv-2 | hdd | fired |
| 10 | 3000 | srv-1 | ram | fired |
Note rows 4 and 5 — identical created_ts. Both workers issue the claim query at the
same moment. Worker A gets the first two keys by enqueue order; worker B skips those locked rows
and takes the next two. Each then sees only its own keys’ alerts.
| Worker | Key | Events it sees | Decision |
|---|---|---|---|
| A | srv-1 / cpu | fired@1000, fired@2600 | OPEN at 1000, alert_count = 2 — the second fired is a touch, not a second incident |
| A | srv-1 / ram | fired@1500, resolved@1800, fired@3000 | the pair is suppressed — both seen in one cycle, so no incident at all — then OPEN at 3000 |
| B | srv-2 / cpu | fired@2000, resolved@2000 | timestamps tie, so id breaks it: 5 > 4, the resolved wins → no incident |
| B | srv-2 / hdd | fired@2200, fired@2500, fired@2900 | OPEN at 2200, alert_count = 3 |
Each worker commits its own transaction independently, and the run produces three incidents. Neither worker waited for the other at any point, and neither could have seen the other’s rows.
What happens when a worker dies
Everything a worker does within a cycle is one transaction, so a worker that dies mid-cycle has
made no partial changes. Its alerts are still marked unprocessed, no half-written incidents exist,
and its dirty_keys locks release the instant the connection drops — there is no lease
to expire and no timeout to wait out. Peers pick the keys up on their next cycle and, because the
fold is a pure function of the rows, the open incidents and the policy, they reach an identical
result.
We tested this rather than asserting it. Mid-run, under live load with chaos injection active,
one of two workers was killed with SIGKILL — no graceful shutdown, no chance to
release anything.
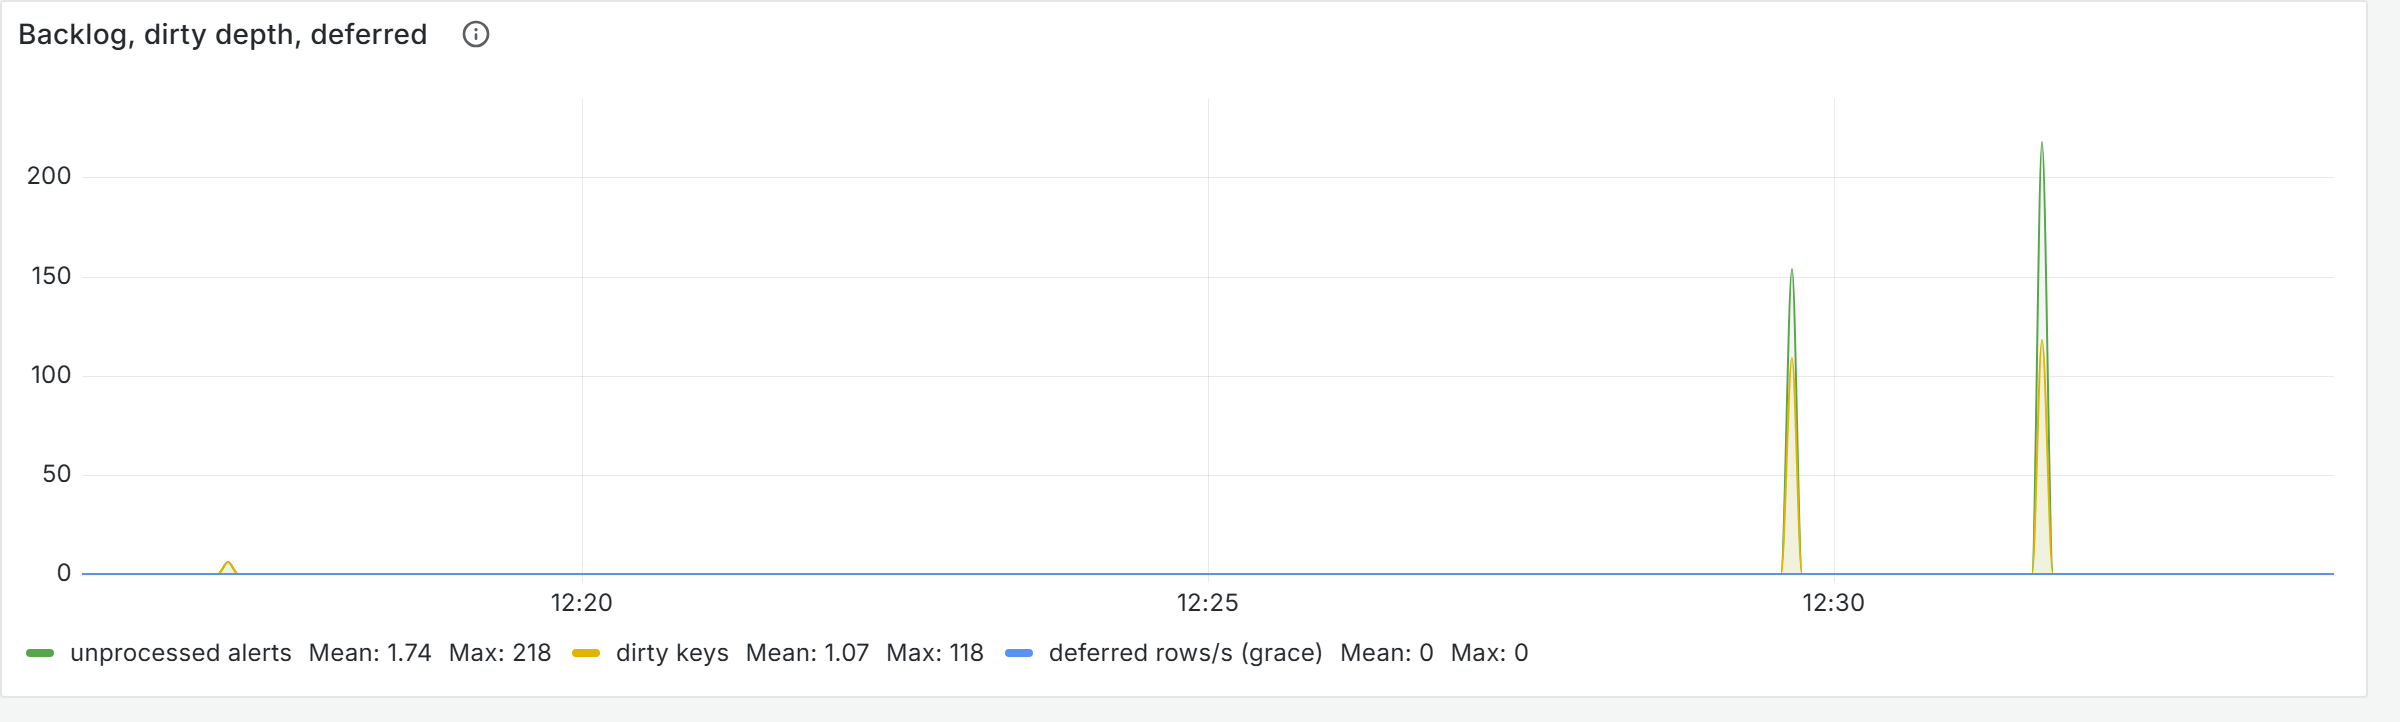
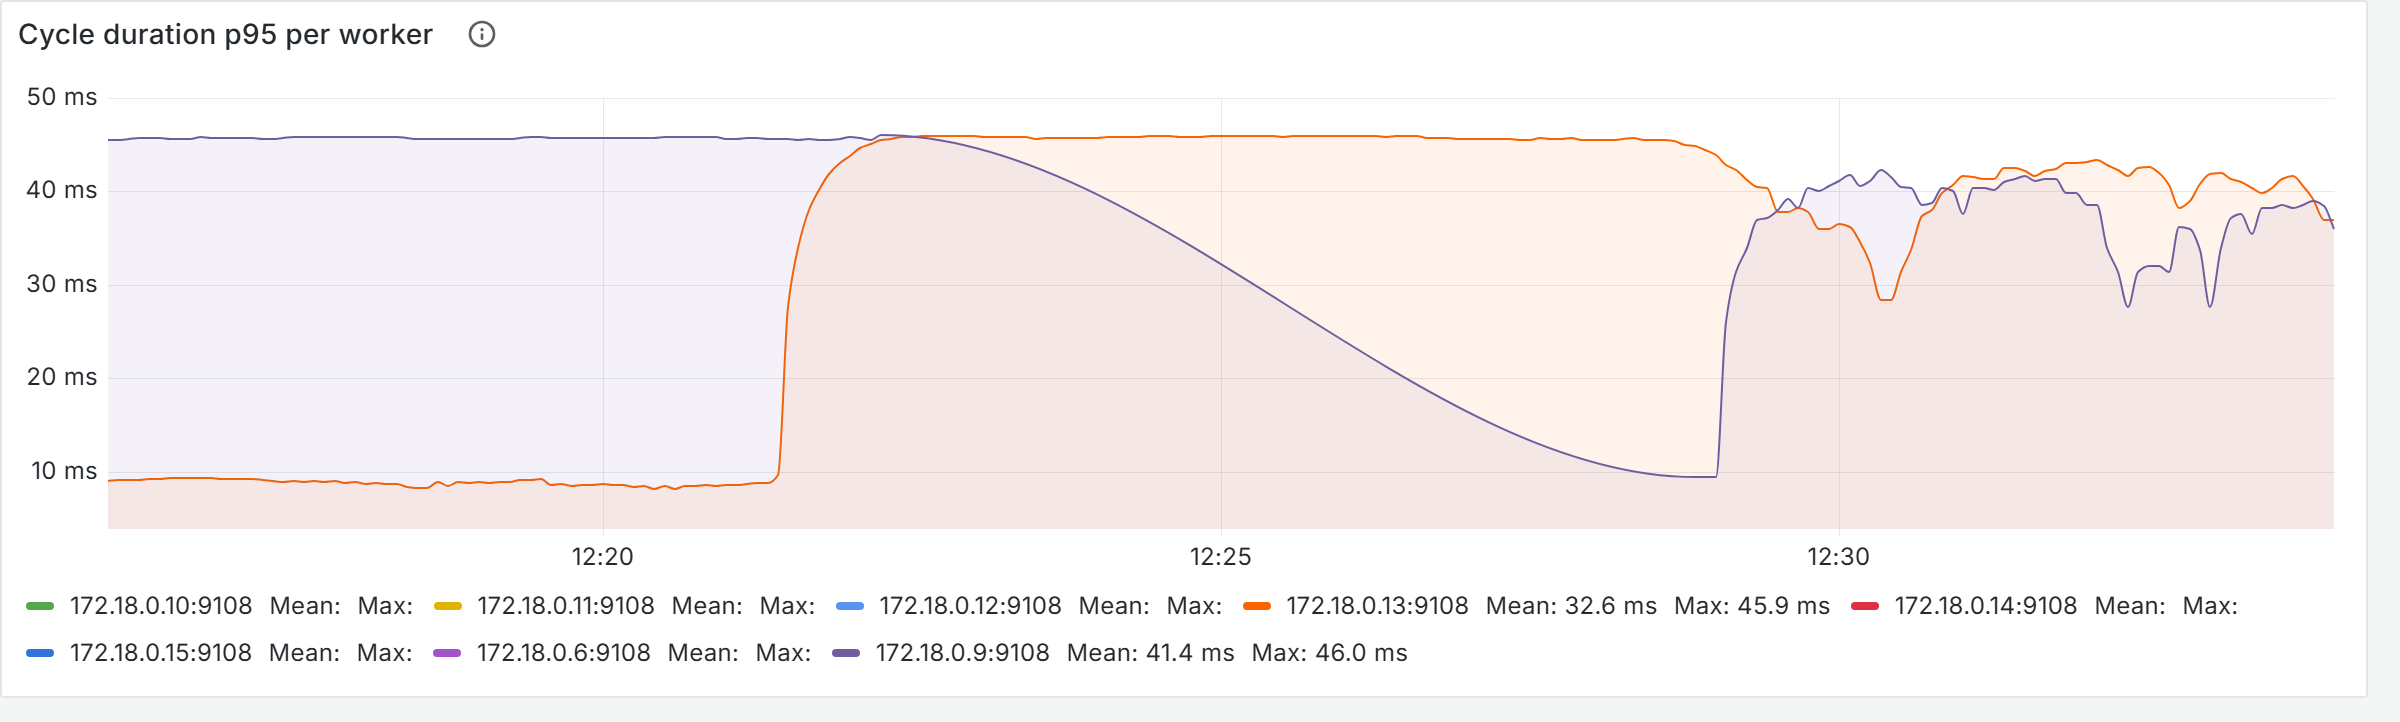
An honest correction to a headline number. Measured in aggregate the cycle p95 barely moved — 41.7 ms before the kill, 45.9 ms after — which makes the failover look almost too easy. The per-worker view above shows why: the aggregate was already dominated by the busy worker, so losing its peer changed it very little. The real evidence of failover is not the aggregate but the idle peer’s five-fold jump as it picked up the work.
What SKIP LOCKED does and does not give you
One result deserves stating plainly, because it is easy to assume otherwise. During the 10 000 alerts/s run all four workers were saturated — each claiming roughly 480 keys per cycle against a configured limit of 500 — yet the work they actually did was markedly uneven:
| Worker | Keys claimed per cycle (p95) | Events processed per second | Cycle p95 |
|---|---|---|---|
| 1 | 484 | 5 800 | 200.5 ms |
| 2 | 478 | 1 632 | 203.1 ms |
| 3 | 483 | 1 478 | 98.5 ms |
| 4 | 481 | 1 060 | 135.0 ms |
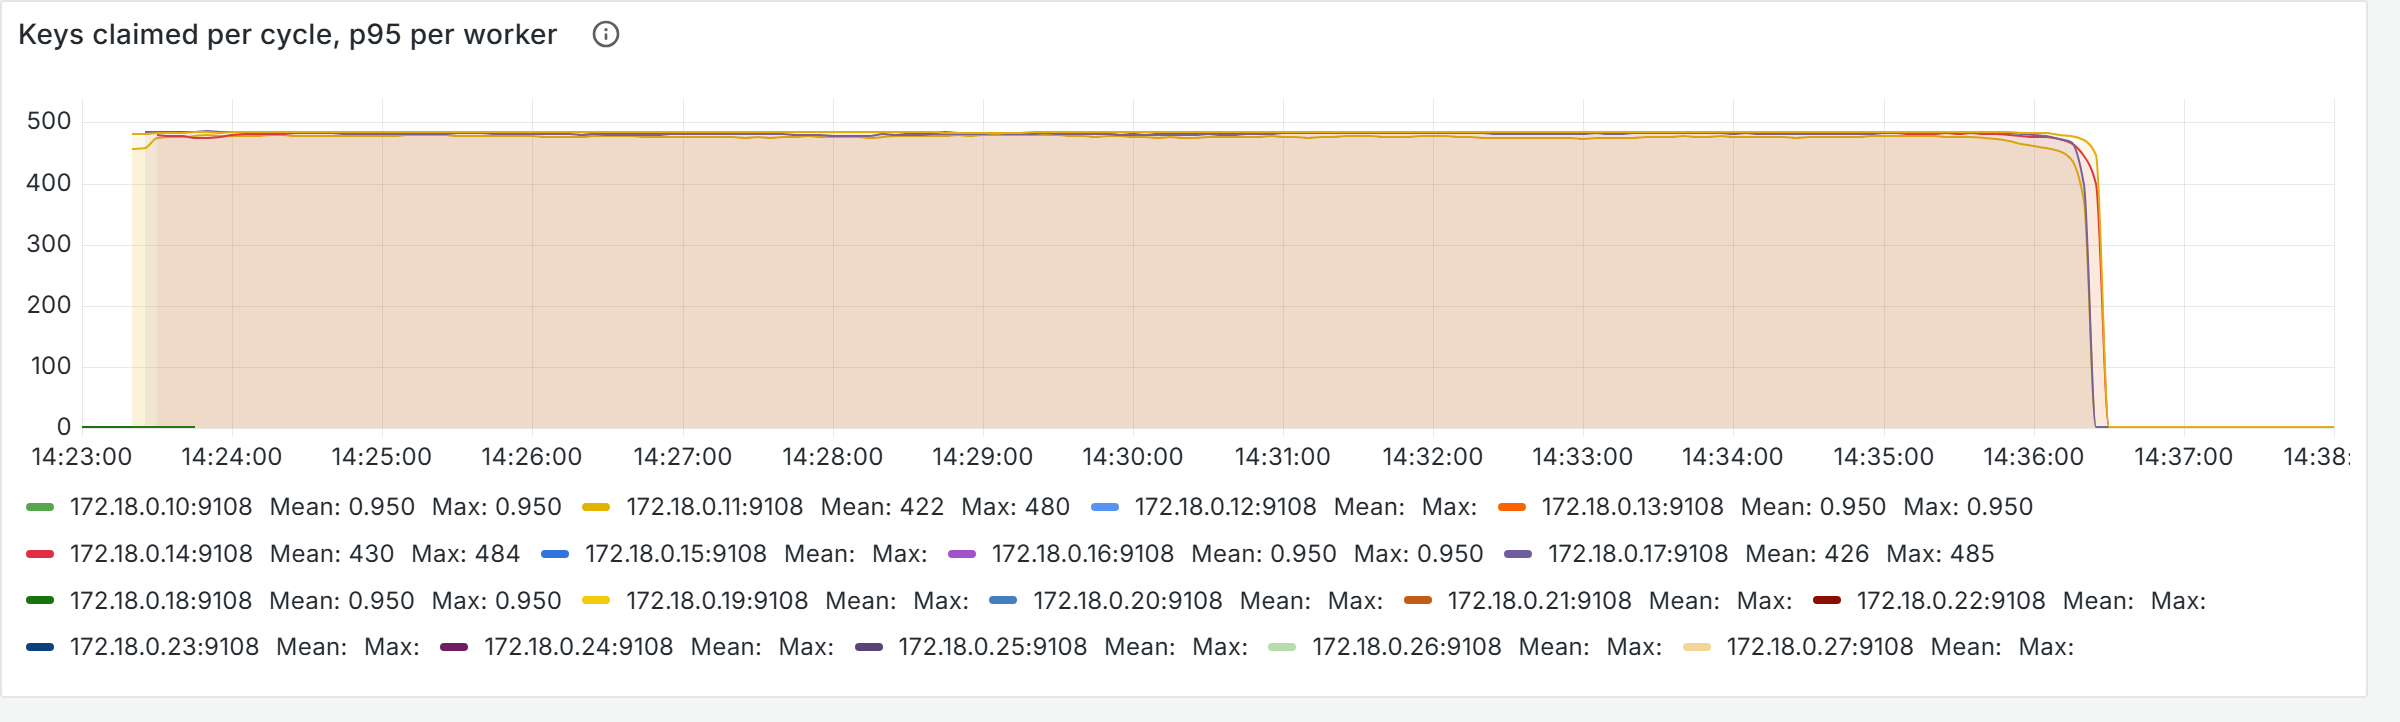
One worker handled 57% of the events. SKIP LOCKED guarantees
disjointness and progress — not fairness. Whichever worker asks first takes what is
available, and keys differ in how many alerts have accumulated behind them.
The reason is the claim limit. During that run the pending-key count sat at 475 against a limit of 500, so the first worker to issue its query could take essentially everything waiting, leaving its peers to pick over what arrived in the interim. That predicts something testable: push the rate until pending keys exceed the limit, and the surplus should have nowhere to go but the peers. The 20 000/s run confirms it exactly.
| Run | Pending keys vs limit | Share taken by each of the four workers | Spread |
|---|---|---|---|
| 10 000/s | 475 of 500 — under | 57% · 16% · 15% · 10% | 5.5 : 1 |
| 20 000/s | 1032 of 500 — over | 35% · 31% · 23% · 11% | 3.1 : 1 |
The practical consequence: adding workers buys headroom and failover, not linear speedup, until pending keys consistently exceed the claim limit. Below that threshold the extra workers are effectively hot standbys — which is exactly what the failover drill showed, where the “idle” worker turned out to be carrying almost nothing until its peer died. Above it, work genuinely spreads. If even distribution ever matters, the lever to reach for is the claim limit, not the worker count.
5 Tested edge cases and scenarios
Twelve categories of awkward behaviour were identified, each with a defined expected outcome.
| Category | What happens | Defined outcome |
|---|---|---|
| Same timestamp | fired and resolved carry an identical created_ts | Resolved by policy — see below |
| Duplicate | Identical payload delivered twice on different offsets | One incident, alert_count = 2 |
| Out-of-order send | resolved sent before its fired, timestamps correct | Timestamp sort repairs it — no incident |
| Early resolved timestamp | resolved stamped before the fired it follows | Sorts first, resolves nothing — the incident opens and stands |
| Flap within a cycle | Several fired/resolved pairs in one batch | All suppressed — no incident churn |
| Flap across cycles | Close and re-open in a single decision | Close applied before open, so the unique index holds |
| Never resolved | Device retired while firing | Incident stays open — a permanent floor |
| Late resolved | resolved arrives 30 s later with its original timestamp | Opens, then closes with the original timestamp |
| Grace defers | A fired episode inside the grace window | Held unprocessed, opens once grace elapses |
| Grace suppresses | A flap entirely inside the grace window | Swallowed — never becomes an incident |
| Stale resolved | resolved older than the incident it meets | Configurable: closes anyway, or is consumed and counted |
| Second fired | Another fired while an incident is open | A touch — alert_count increments, no second incident |
The same-timestamp case
This is the headline case and the reason the alerts table carries a monotonic
id. When a fired and a resolved for one key share the exact
same millisecond, “which came last” is genuinely ambiguous — the data does not contain the answer.
Rather than letting the outcome fall out of whatever the sort happened to do, the ambiguity is
made explicit and configurable. Events are sorted by
(created_ts, policy_rank(state), id):
| Policy | On a timestamp tie | Result for one fired+resolved pair |
|---|---|---|
arrival (default) | The row the pipeline saw last wins, by id | Depends on send order — honest about what actually arrived |
prefer_resolved | The resolved always wins | Never opens — optimistic |
prefer_fired | The fired always wins | Always opens — pessimistic |
The 18 scenarios
Each scenario sends an exact alert sequence through real Kafka into real PostgreSQL, then drives the processing cycles directly rather than waiting on daemon timing. That is what makes “same cycle” versus “next cycle” a property of the test rather than of luck. Every object id is namespaced per run, and the run holds an advisory lock that makes background workers stand down, so results cannot be polluted.
| # | Scenario | What it pins | Result |
|---|---|---|---|
| 01 | basic_open | A lone fired opens exactly one incident | PASS |
| 02 | basic_open_close | Full lifecycle across two cycles | PASS |
| 03 | same_ts_arrival_fired_first | No incident — the resolved has the higher id | PASS |
| 04 | same_ts_arrival_resolved_first | Opens — the fired has the higher id | PASS |
| 05 | same_ts_prefer_resolved | Policy suppresses what arrival would open | PASS |
| 06 | same_ts_prefer_fired | Policy opens what arrival would suppress | PASS |
| 07 | duplicate_fired | One incident, alert_count = 2 | PASS |
| 08 | out_of_order_send | Timestamp sort repairs the send order | PASS |
| 09 | early_resolved_ts | A resolved stamped too early resolves nothing | PASS |
| 10 | flap_within_cycle | Three pairs in one cycle produce nothing | PASS |
| 11 | flap_across_cycles | Close and re-open in one decision, then close | PASS |
| 12 | never_resolved | Still open after repeated cycles | PASS |
| 13 | late_resolved | Opens first, closes later with the original timestamp | PASS |
| 14 | grace_defers_then_opens | Deferred, then opens once grace elapses | PASS |
| 15 | grace_suppresses_flap | Grace swallows the flap entirely | PASS |
| 16 | second_fired_touches | A touch, not a second incident | PASS |
| 17 | stale_resolved_closes | Closes anyway, closed_ts < opened_ts | PASS |
| 18 | stale_resolved_ignored | Stays open, resolved consumed and counted | PASS |
18/18 passed, each in 0.26–2.56 seconds. Alongside these, 161 unit tests cover the decision function directly, and run inside the container image so they exercise the same code the rig ships.
6 Test results
Three load runs were executed. Every parameter in the tables below is explained in its own column, since several of them only make sense against the design that produced them.
6.1 Functional soak — 5000 alerts/minute, chaos on, 32 minutes
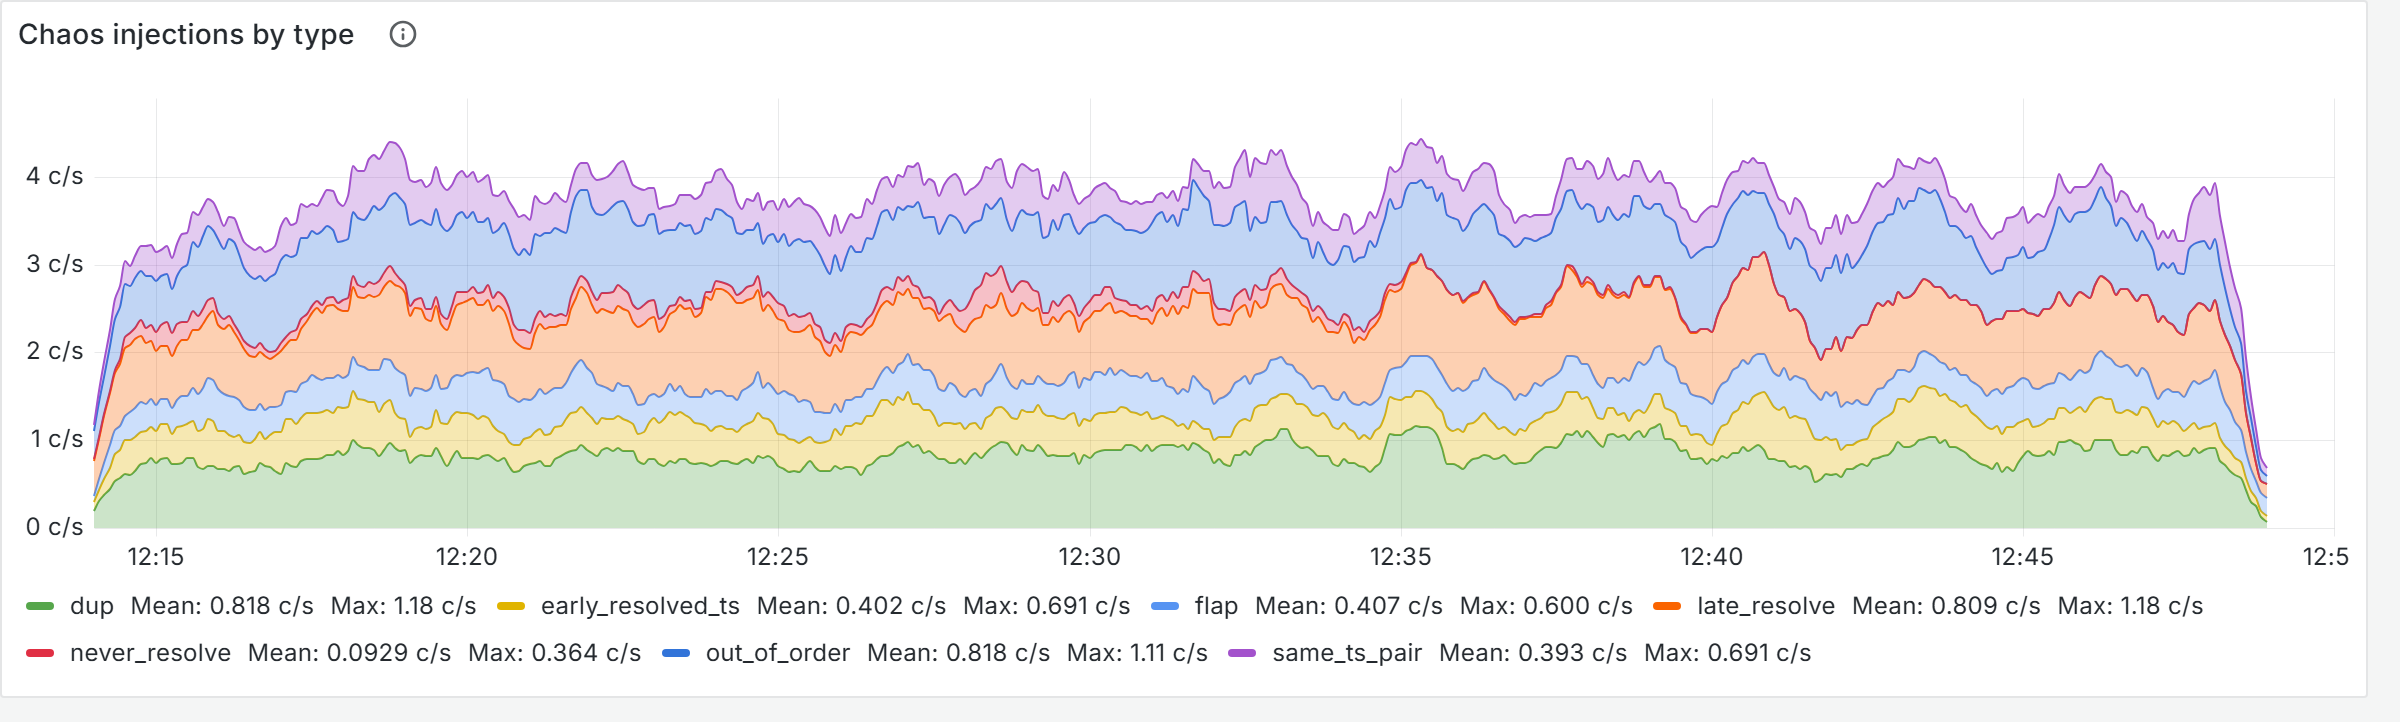
A deliberately modest rate held for a long period, with all seven chaos injectors active. The purpose is not throughput but endurance: backlogs that creep, counters that grow without bound, connections that leak, latencies that drift.
| Parameter | What it measures | Target | Measured |
|---|---|---|---|
| Consumer lag | Messages sitting in Kafka that the receivers have not yet consumed. A rising value means ingestion cannot keep up | ≈ 0 | max 21 |
| Unprocessed backlog | Alert rows written to the database but not yet folded into a decision. The workers’ queue depth | < 1000 | max 218, mean 1.74 |
| End-to-end latency p50 | Median time from an alert’s own timestamp to its database commit | — | 134 ms |
| End-to-end latency p95 | The same at the 95th percentile | — | 258 ms |
| End-to-end latency p99 | The same at the 99th percentile — dominated here by a deliberate injector, see §7 | — | mean 6.91 s, max 37.2 s |
| Cycle p95 | How long a worker’s claim-fold-write cycle takes, against a 2 s interval | < 1.6 s | 37–46 ms |
| Send / insert / malformed errors | Producer failures, insert failures, unparseable messages | 0 | 0 |
| Open incidents per key | The headline invariant, enforced by a partial unique index | ≤ 1 | no violations |
Totals: 180 907 alerts, 64 864 incidents, and 10 811 re-opens — that last figure matters, because a close and an open occurring in a single decision is the trickiest path in the fold, and it executed nearly eleven thousand times without once tripping the unique index.
6.2 Stress at the design target — 6000 alerts/s, 33.5 minutes
Twenty generators, three receivers, four workers. Chaos off, for reasons explained in §7.
| Parameter | What it measures | Gate | Measured (worst) | Margin |
|---|---|---|---|---|
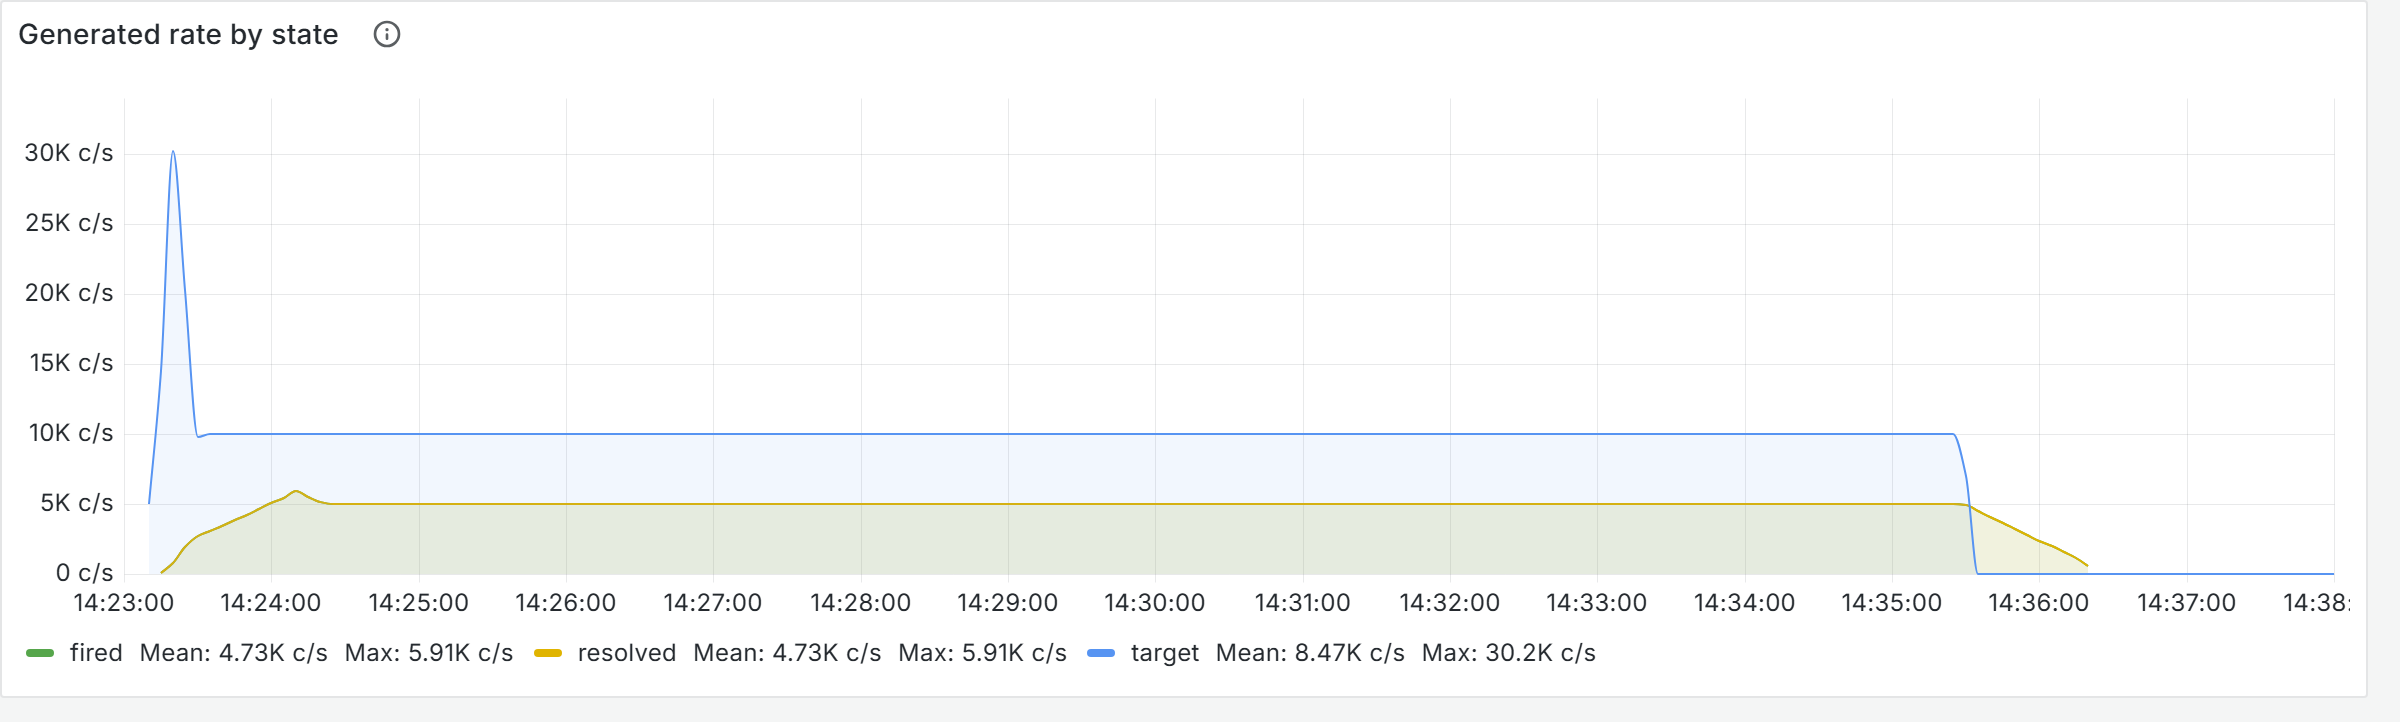
| Sustained rate | Alerts actually produced, consumed and inserted per second | 6000/s | 6000/s exactly | held |
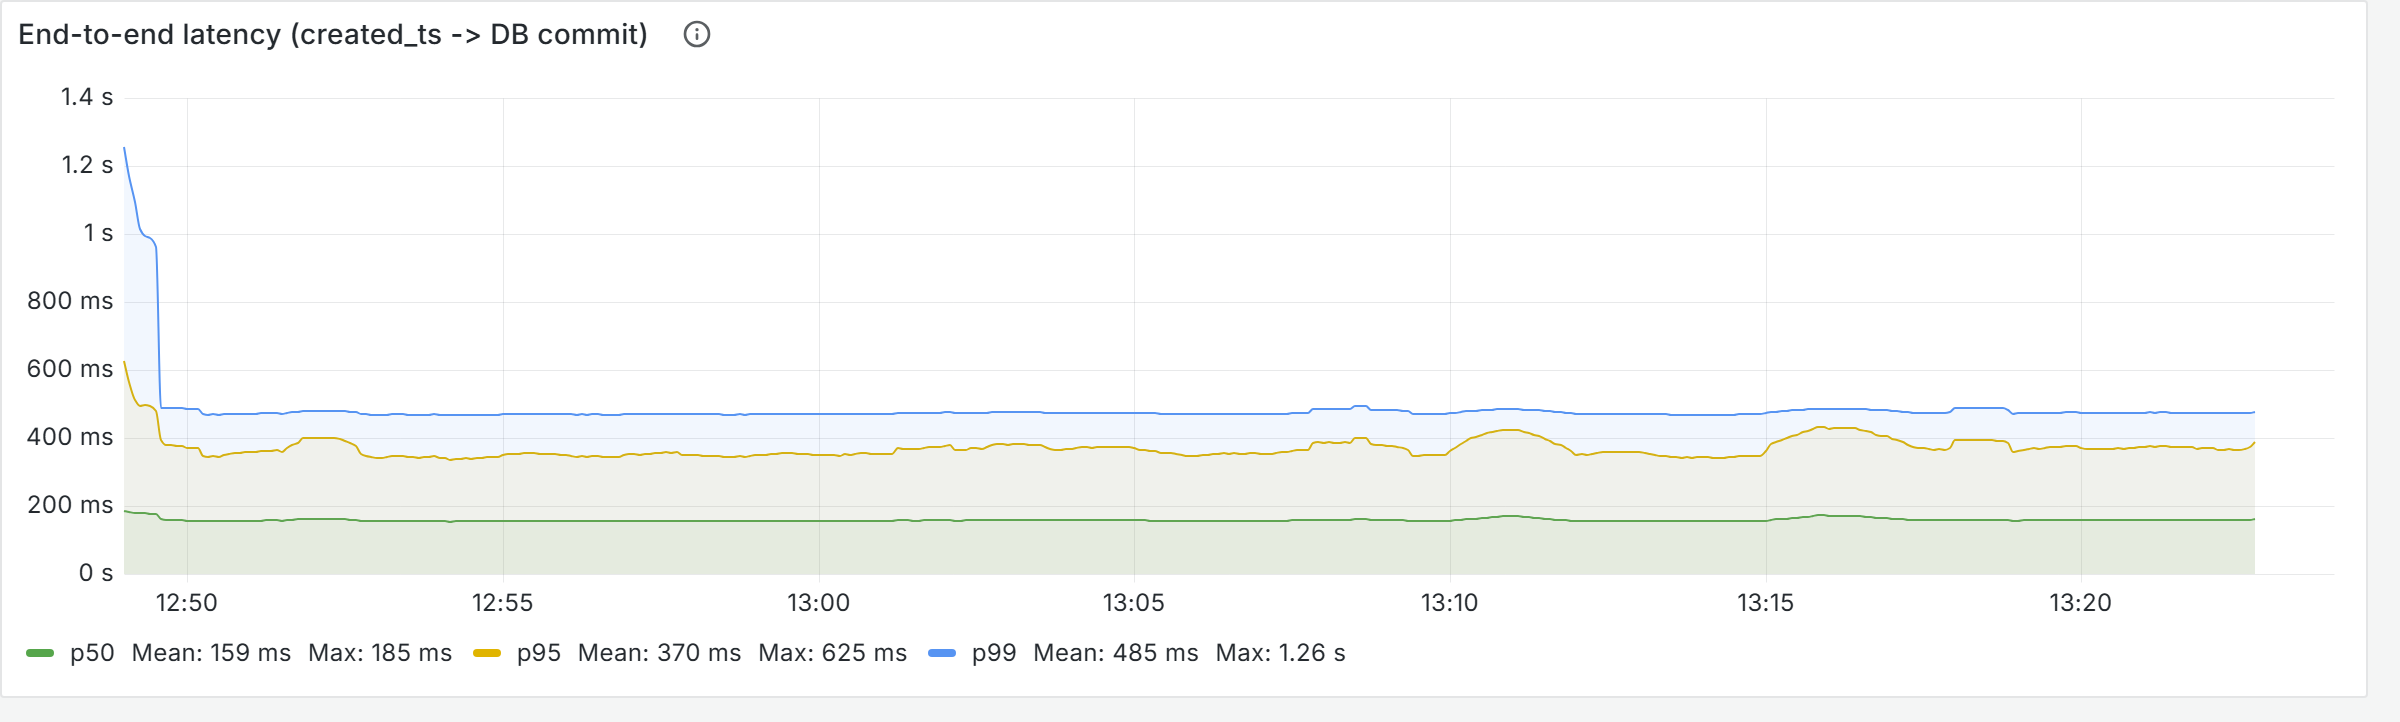
| Consumer lag | Kafka backlog; must be bounded and flat, not growing | < 20 000 | 1 095 | 18× |
| End-to-end latency p99 | Alert timestamp to database commit, 99th percentile | < 5 s | 1.177 s | 4× |
| Unprocessed backlog | Worker queue depth; must return to zero rather than accumulate | < 100 000 | 6 851 | 15× |
| Cycle p95 per worker | Cycle duration against 80% of the 2 s interval | < 1.6 s | 0.224 s | 7× |
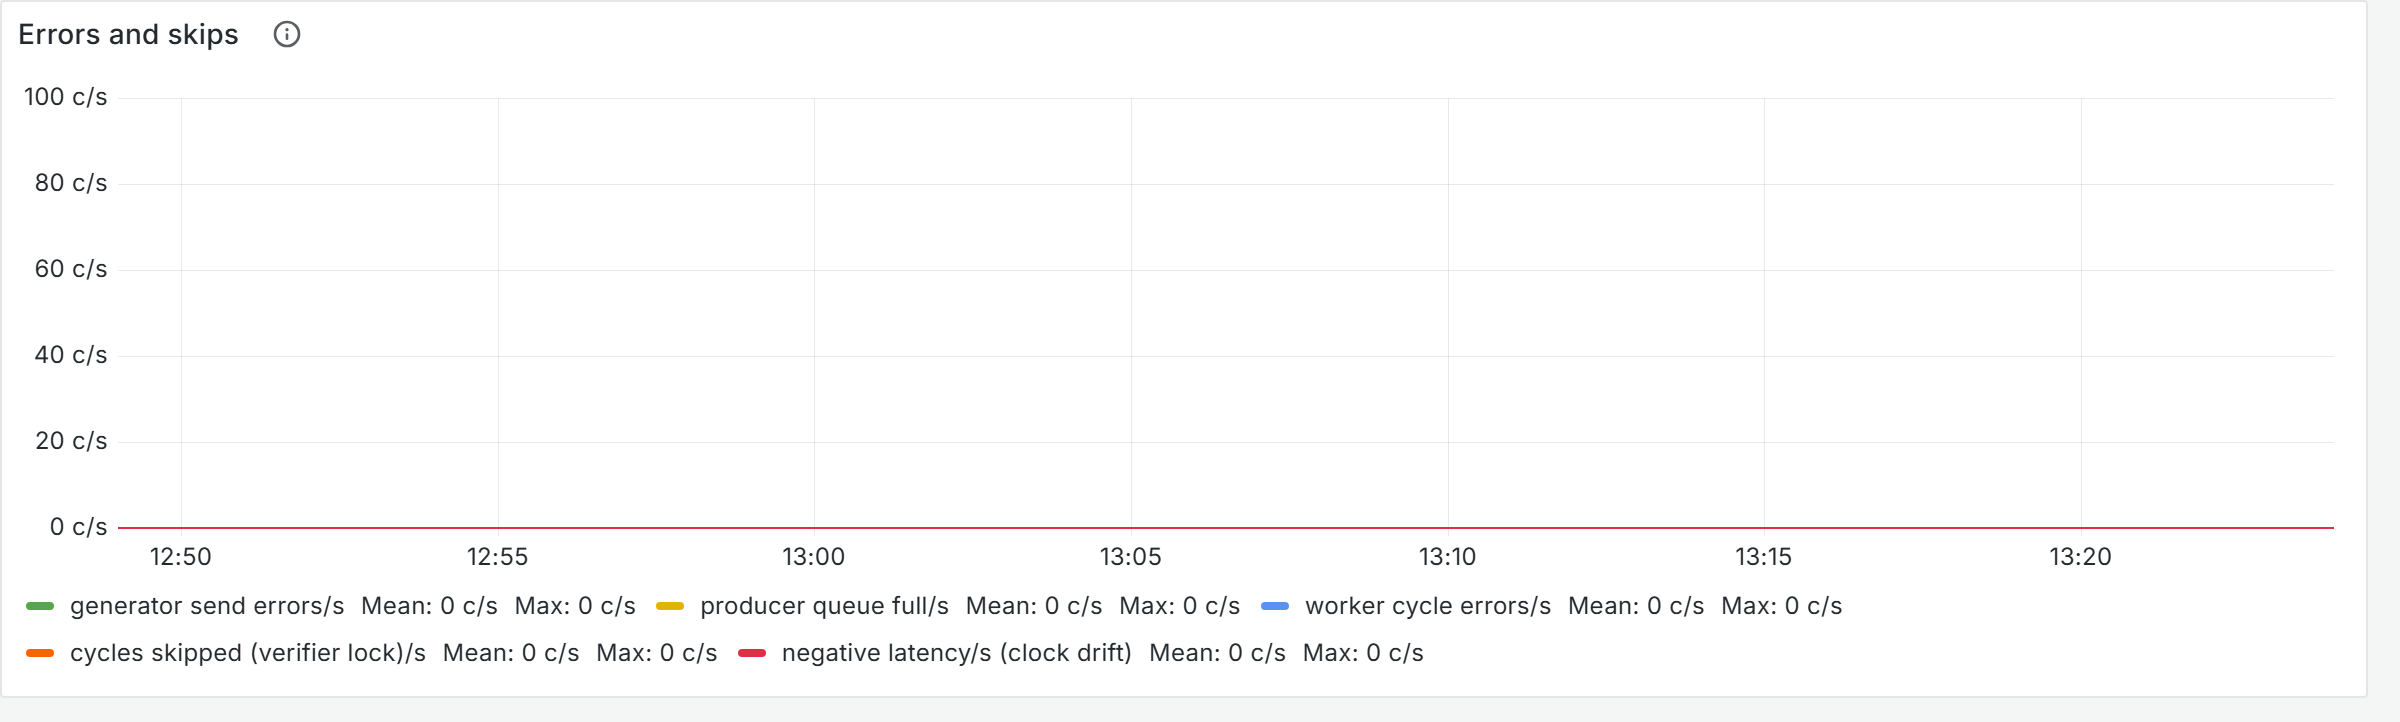
| Errors | Send, insert, malformed, negative-latency and skipped-cycle counters | 0 | 0 | — |
| Open incidents per key | The invariant, checked directly in SQL after the run | ≤ 1 | 0 violations | — |
Totals: 12 065 149 alerts, 1 644 085 incidents, 4.16 million suppressed pairs, and 3079 MB in PostgreSQL — within the 3–4 GB predicted during design. After the generators stopped, the backlog drained to zero within 25 seconds.
6.3 Stress beyond the target — a controlled rate series
Three rates, ten minutes each, identical topology throughout — 20 generators, 3 receivers, 4 workers — with a full database truncate and a 150-second warm-up before each. Equal durations make the three directly comparable, so rate is genuinely the only variable. Values are the worst observed across a nine-minute window that excludes the warm-up. This series ran on the build carrying the §4 repair, so it also measures whether that fix costs anything.
| Parameter | Gate | 6000/s | 10 000/s | 20 000/s | Direction |
|---|---|---|---|---|---|
| Sustained rate | — | 6000/s exactly | 10 000/s exactly | 20 001/s | held at every rate |
| Alerts consumed | — | 6000/s | 10 000/s | 19 999/s | receivers kept pace throughout |
| Consumer lag | < 20 000 | 1 037 | 2 634 | 7 585 | rises with load, stays bounded |
| End-to-end latency p99 | < 5 s | 0.479 s | 0.495 s | 0.926 s | flat, then a first rise |
| Unprocessed backlog | < 100 000 | 1 234 | 1 410 | 12 451 | flat, then a first rise |
| Cycle p95 | < 1.6 s | 0.131 s | 0.098 s | 0.404 s | flat, then a first rise |
| Errors | 0 | 0 | 0 | 0 | send, insert, malformed — all zero |
| Open incidents per key | ≤ 1 | 0 violations | 0 violations | 0 violations | invariant held |
| Alerts processed | — | 4 630 968 | 7 714 567 | 15 430 096 | 10 minutes each |
| Database size | — | 1353 MB | 2168 MB | 3839 MB | ~250 B per alert |
Every gate passed at every rate, the tightest by a factor of 2.6. Each run drained to zero unprocessed once the generators stopped, and a direct query for keys holding unprocessed alerts with no work marker returned zero — the state §4’s repair exists to prevent.
20 000/s is where strain first appears. Latency, backlog and cycle time are flat from 6000 to 10 000 — cycle p95 actually falls, 0.131 s to 0.098 s — and all three rise together at 20 000. Nothing comes close to a gate, but the flatness that characterises the lower rates is gone. If a knee exists, this is the first sight of the approach to it.
The §4 repair costs nothing measurable. Against the same rates measured before it existed,
cycle p95 improved at 6000/s (0.224 → 0.131 s) and at 10 000/s (0.196 → 0.098 s), while lag and
backlog moved within ordinary run-to-run variance. It adds one indexed statement per cycle, bounded
by claim_keys, and the measurements cannot distinguish it from noise.
fired and resolved, which is the expected steady state of the device
model.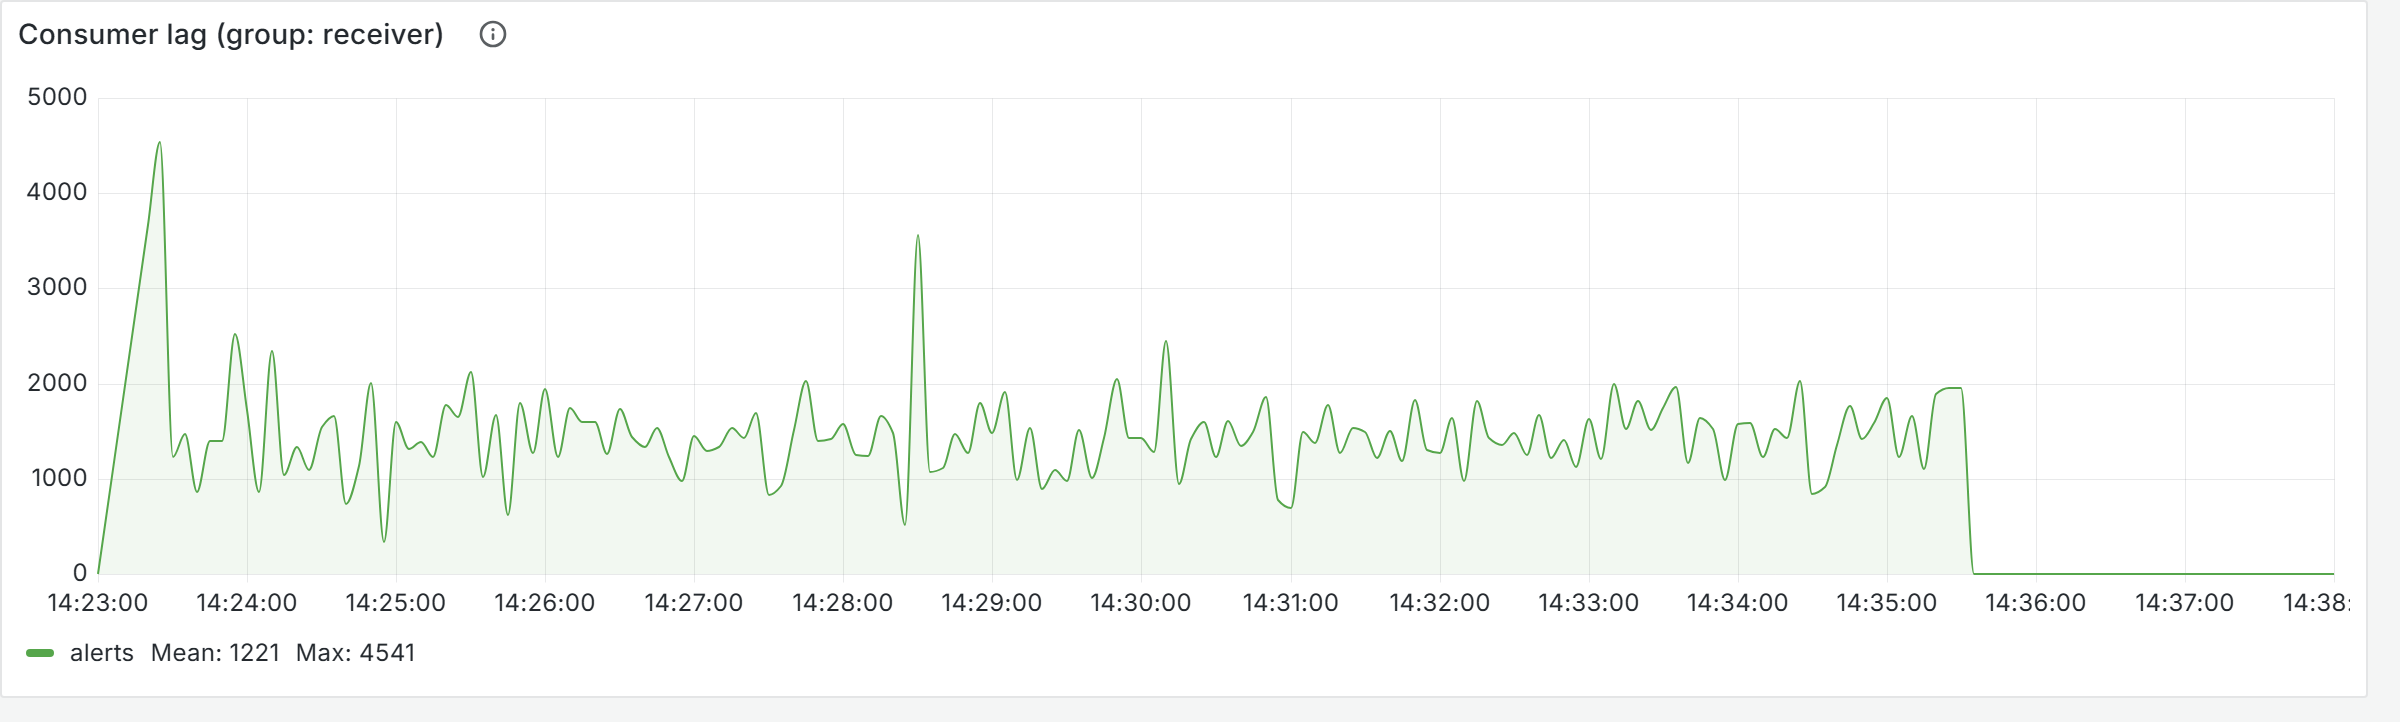
6.4 The scaling result worth stating plainly
Across a 3.3× range of alert rate — 6000 to 20 000 per second on identical hardware and an identical topology — cycle time stayed within a 0.196–0.347 s band and end-to-end latency moved by 21 milliseconds. That is the most useful thing the exercise learned, and it has three parts:
- Worker cost tracks key count, not alert rate. There are 2000 keys at every rate. More alerts per second means more rows folded per key — cheap in-memory work — while the expensive parts of a cycle (claiming, the join, the batched writes) are per key and unchanged. Alert rate is therefore not the axis that will break this design, which is why tripling it barely moved the workers.
- End-to-end latency is set by configuration rather than by load, up to the point of saturation. In steady state it held at 0.474 / 0.489 / 0.495 s across the three rates, governed by the receiver’s 200 ms batch timer plus Kafka’s linger rather than by throughput — so lowering it is a configuration change, not a hardware one. That holds only while the pipeline keeps pace: in the final minutes at 20 000/s, p99 rose to 0.869 s, which is load showing through.
- Consumer lag is the one measurement that tracks rate, rising 1 095 → 1 831 → 5 593. It stayed bounded rather than climbing at every rate, so the receivers kept pace throughout — but it is the number to watch first when pushing further, and three receivers are the component to scale next.
No knee was found within the range tested, though 20 000/s produced the first non-flat behaviour. The limits this design should meet first are key cardinality — not alert rate — and PostgreSQL write throughput.
7 Findings and deviations
A gate that could not measure itself
The stress script enabled chaos injection by default. One of those injectors,
late_resolve, deliberately holds back 1% of resolved alerts for 30 seconds
while preserving their original timestamp. Since end-to-end latency is measured as
“now minus the alert’s own timestamp”, those alerts land with a ~30 second latency by design — and
at exactly 1% of traffic they sit precisely on the 99th percentile boundary.
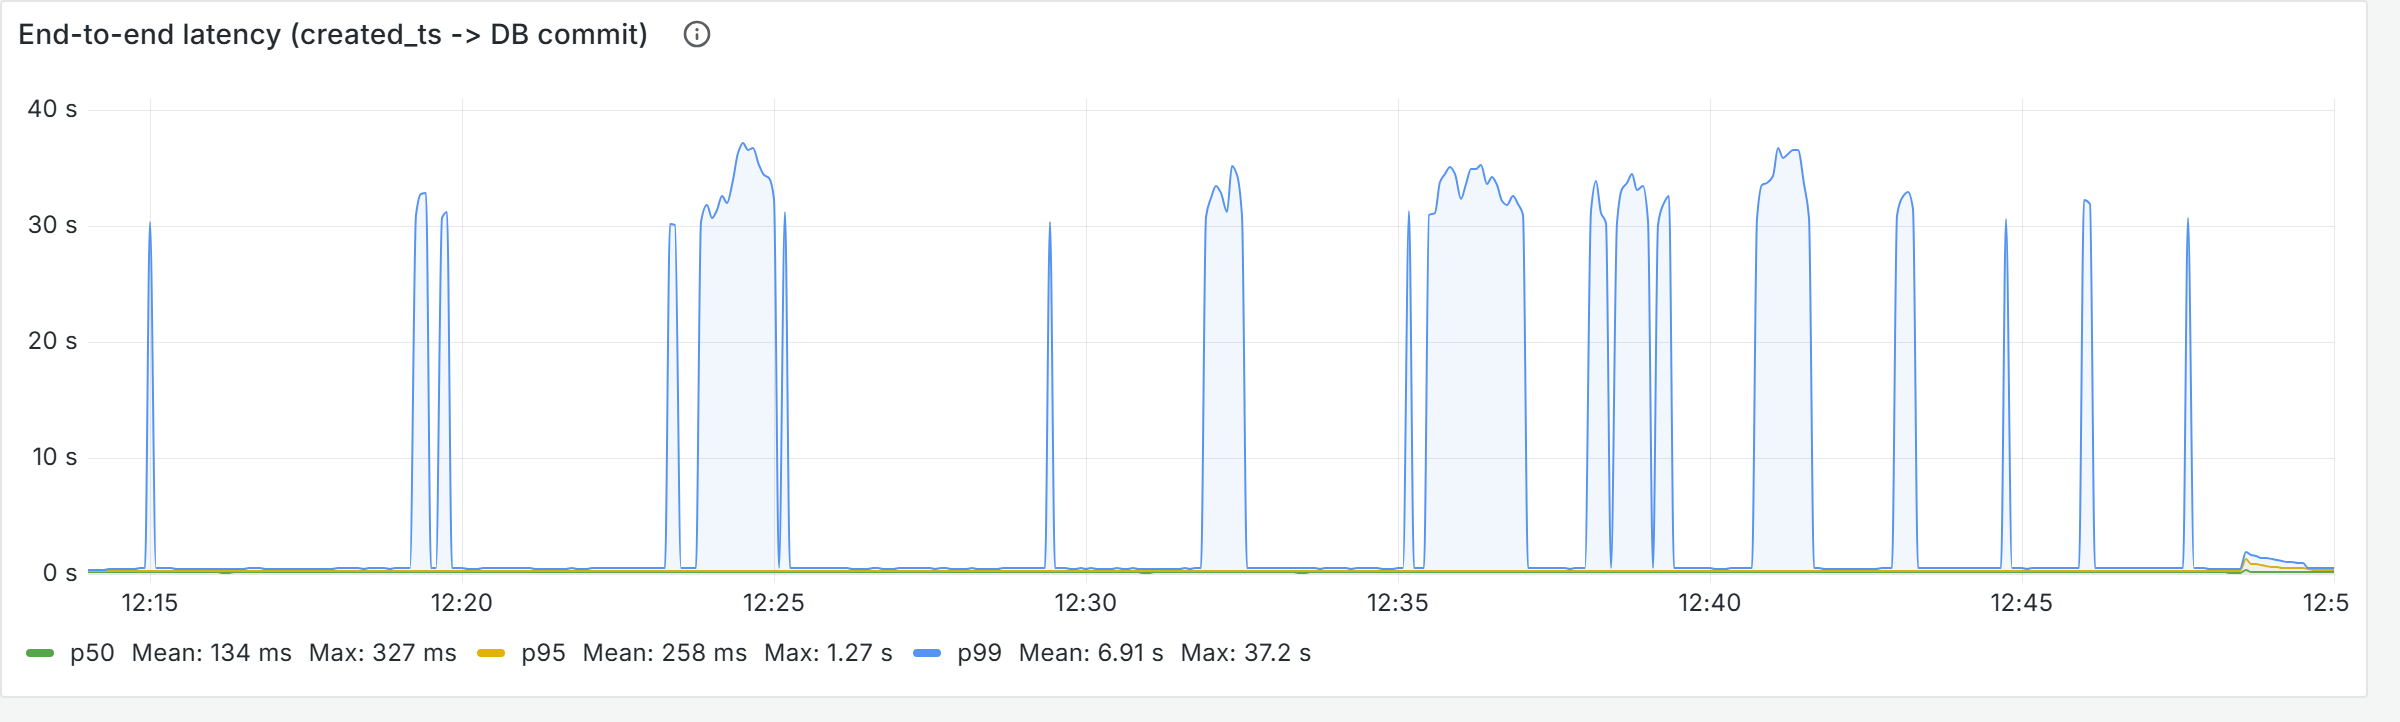
The consequence is that the stress run’s own “p99 under 5 s” gate was unmeasurable while chaos was on. This was corrected: the stress script now defaults to chaos off, matching the design document, which lists chaos under functional soaking rather than stress. Chaos at scale remains available as an explicit flag, with the guidance to read p95 rather than p99. Worth noting that the rig was working correctly throughout — this was a measurement design fault, not a defect, and it was the graph above that exposed it.
The open-incidents gauge tracks something narrower than documented
The design predicted that the count of open incidents would track
never_resolve + early_resolved_ts injections. In practice it settles at the
never_resolve floor — exactly 200, the configured cap — plus roughly 100 transient
incidents from devices currently in a firing state. An early_resolved_ts incident does
open as designed, but is later closed by the device’s next natural resolve, so it drives churn
rather than accumulating. The observed 298–323 against 400 total keys, of which 200 are retired,
matches that reading exactly. The behaviour is correct; the documented expectation was loose.
SKIP LOCKED distributes claims, not work
Covered in §4 — worth repeating here because it is the finding most likely to matter operationally. Work begins spreading to peers only once pending keys exceed the claim limit (500) — below that the first worker to ask takes everything available — and all N workers are fully fed only once pending keys approach claim limit × N. Between those two points, extra workers buy headroom and failover rather than linear speedup.
Dashboard legends list every container
The shared metrics module registers all metric families in every process, so a generator also exposes worker metrics sitting at zero. Queries grouped by instance therefore return a series for every container, and several panel legends list entries with no data. Cosmetic, but it makes the dashboard noisier than it needs to be.
Six defects found before the load runs
Independent review of the implementation found six bugs, all fixed and each covered by a regression test. Three would have failed silently, which is the category worth listing:
- The receivers would have ingested nothing. Supplying Kafka rebalance callbacks replaces the client library’s default handling; without explicitly assigning the partitions, the receivers would have looked perfectly healthy while consuming zero alerts.
- A dead database connection was never rebuilt. A rollback cannot rescue a socket-level failure, so every later flush would have failed and Kafka offsets would have stalled silently.
- The late-resolve injector cancelled itself out. It returned the device to a normal state, so the device flapped during the 30 s delay and the held-back resolved arrived as a no-op. Devices are now parked until their delayed alert is released.
The remaining three concerned a fixed sleep after an asynchronous topic delete, a greedy incident matcher in the verifier that could report a false failure on a valid result, and a generator identity truncated to 16 bits — roughly a 0.3% chance that two of twenty replicas would collide and emit the same keys. The 20-replica runs confirm the fix: no collisions.
8 Conclusion
Both acceptance gates were met. The eighteen edge-case scenarios pass against real infrastructure, so the ambiguous alert sequences — including the same-millisecond case that motivated the exercise — have defined, repeatable outcomes rather than emergent ones. Under load the pipeline held its design target of 6000 alerts/s with every gate met by a factor of four to eighteen, then held 10 000 and 20 000 alerts/s on unchanged hardware, the tightest gate at 20 000/s still 2.6× inside its limit. 40 million alerts were processed across the runs with zero send failures, zero insert failures, zero malformed messages and zero invariant violations.
On the question that was least clear at the outset — how to make the incident workers
horizontally scalable and fail-safe — the answer turned out to require no distributed-systems
machinery at all. A work-queue table written in the same transaction as the data it refers to,
plus FOR UPDATE SKIP LOCKED, is enough to guarantee that workers take disjoint work,
never block one another, and cannot deadlock. The database that already had to be consistent is
also the coordinator, so there is no second thing to keep alive. Scaling is one flag. A worker
dying mid-work costs a rolled-back transaction and nothing else, which we demonstrated under live
load rather than argued: the backlog never left zero, and the surviving peer picked up the entire
workload within one cycle.
Two caveats are worth carrying into any production use. Distribution across workers is not
even — SKIP LOCKED gives disjointness and progress, not fairness — so additional
workers should be sized as headroom and redundancy rather than as linear throughput. And
end-to-end latency here is set by the receiver’s batching configuration rather than by capacity,
so a lower latency target is a tuning decision, not a hardware one.
No performance ceiling was found within the scope of this exercise, across a 3.3× range of alert rate. The 20 000/s run produced the first sign of strain — backlog and cycle time rose in its final minutes while remaining far inside their limits — and consumer lag was the only measurement that tracked load throughout, which makes the three receivers the component to scale next. Beyond that, the limits this design should actually meet first are key cardinality rather than alert rate, and PostgreSQL write throughput.
Appendix A Could the database do this without a dirty_keys table?
A fair question to ask of any hand-rolled mechanism. Answering it starts with naming precisely what the table provides, because it is not one thing but two:
- Discovery — which keys currently have pending work.
- A lockable object per key — something a worker can take an exclusive lock on. PostgreSQL can only lock rows that exist, so wanting per-key exclusion means materialising a row per key.
Most queueing technology supplies the first plus FIFO ordering across messages. Very little supplies the second — per-key affinity — and that is the part this system actually depends on.
PostgreSQL, without adding a table
Advisory locks are the genuine alternative. They are lock objects that need no row:
WITH candidates AS (
    SELECT DISTINCT obj_id, metric_id FROM alerts
    WHERE NOT processed LIMIT 5000
)
SELECT obj_id, metric_id FROM candidates
WHERE pg_try_advisory_xact_lock(hashtextextended(obj_id || '|' || metric_id, 0))
LIMIT 500;
pg_try_advisory_xact_lock returns false rather than waiting — the same non-blocking
behaviour as SKIP LOCKED — and releases at commit, so a killed worker still frees its
keys instantly. Discovery comes free from the partial index
(obj_id, metric_id, id) WHERE NOT processed, which is already a queue:
dirty_keys is essentially a materialised DISTINCT over it.
Three costs, none fatal but all real. The lock predicate is evaluated on every row the scan
touches, not every row it returns, so a worker can hold locks on keys it never
claimed — harmless, but it blocks peers for the cycle. The enqueued_at FIFO fairness
disappears. And DISTINCT over the backlog costs more than reading a 2000-row table
once the backlog is large.
What does not work: LISTEN/NOTIFY signals but grants no exclusivity, and
notifications are lost when no one is listening. Locking alert rows directly with
SKIP LOCKED fails because “lock every row sharing this key” is not expressible —
PostgreSQL rejects FOR UPDATE with DISTINCT. Locking one sentinel row per
key via a CTE almost works, but two workers can select different sentinels for the same key, which
reintroduces precisely the concurrency hazard §4 exists to prevent.
Extensions — pgmq (PostgreSQL 14–18, used by
Supabase) and PgQue, a modern descendant of Skype’s
PgQ — are built on FOR UPDATE + SKIP LOCKED underneath and still create
tables. They add visibility timeouts and archiving, not per-key affinity. pgmq’s own design notes
raise the same bloat concern weighed in §4 when choosing how to repair the cleanup race: queues
built this way generate dead tuples that VACUUM has to chase.
Engines that provide it natively
| Engine | Mechanism | Fit |
|---|---|---|
| SQL Server Service Broker | Conversation group locks — an exclusive lock over a set of related messages, taken automatically, held for the transaction, guaranteeing one reader per group and in-order processing | Near-exact. One conversation group per key gives dirty_keys + SKIP LOCKED + per-key ordering, engine-supplied |
| Oracle Advanced Queuing | Transactional in-database queues with message groups | Close — per-group dequeue semantics |
| MySQL 8 | SKIP LOCKED | The same manual pattern ports directly |
| CockroachDB / YugabyteDB | Distributed SQL, MVCC | Verify before relying on it. CockroachDB long lacked SKIP LOCKED, and there are open reports of poor performance and of it skipping rows that are not locked |
Service Broker deserves the note: it is unfashionable and largely forgotten, but it solved this exact problem as a first-class engine feature. The design in §4 is a hand-rolled version of its conversation group lock.
The distributed-SQL row is the one that matters operationally. This entire design rests on a single SQL clause; if this workload were ever moved onto CockroachDB or YugabyteDB, that clause is the first thing to validate, not an implementation detail to assume.
The mechanism already exists one hop upstream
Worth noticing: Kafka already provides per-key ownership. Messages are partitioned by
obj_id|metric_id, so one partition maps to one consumer — per-key exclusivity, with
failover through consumer-group rebalancing. The dirty_keys mechanism re-derives
inside PostgreSQL exactly what Kafka supplies a hop earlier. If alert2inc consumed
Kafka directly, neither the table nor SKIP LOCKED would be needed at all.
That is forbidden on purpose: the processor reads only PostgreSQL, because it emulates a real system whose processor queries a database rather than a broker. The table exists because of a modelling constraint, not a technical one — which is worth knowing before treating it as an inherent cost.
Recommendation
Keep dirty_keys. It stays around 2000 rows, it provides FIFO fairness that advisory
locks cannot, and it keeps discovery cheap as the backlog grows. Per-key advisory locks are a
credible drop-in if removing the table ever became a goal, but they trade fairness and
large-backlog performance for one fewer table — a poor trade at this scale.
References: Conversation Group Locks · Conversation Groups · pgmq · pgmq design notes · PgQue · CockroachDB FOR UPDATE · YugabyteDB explicit locking